It’s that time of the decade again. The census is done and now the data is starting to flow. It’s free candy for reporters [Detroit -25%] and, since it’s 2011, you are going to see this data like never before. Of course, it takes time to get through it all, but the New York Times is offering some 2005-2009 data while you wait…
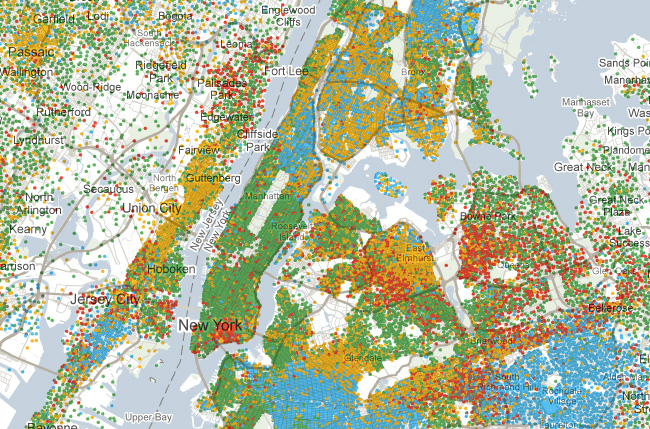 (click to launch NYT’s Mapping America: Every City, Every Block)
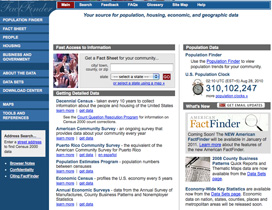
And in case you’d like to check out some of the data yourself, the U.S. Census Bureau has rolled out FactFinder2:
 |
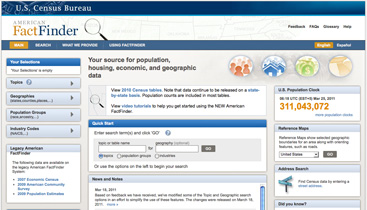 |
While definitely easier on the eyes and more technically sophisticated, the sugarcoating is skin deep as FactFinder2 is also sort of confusing, if not discouraging, to use. ACM recommends a deep breath before going in.
[NYT’s Mapping America: Every City, Every Block; FactFinder2; FactFinder1]
