The formula for soft drinks is pretty simple, which might explain why there are so many of them on the market. Water + a Sweetener + a Flavoring Agent = Good Margins. Add in caffeine and fruit juice as needed.
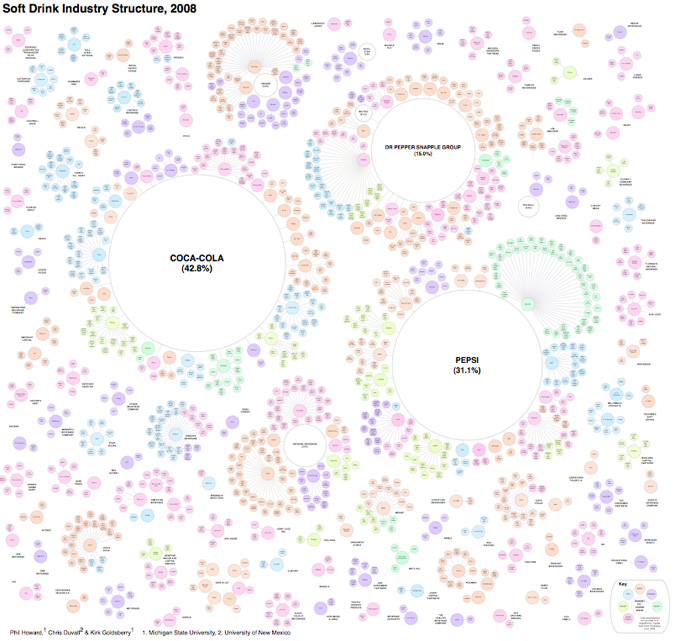
The following chart, however, is called The Illusion of Diversity for a reason.
It’s generally known that Coke and Pepsi are a big part of the industry, but what isn’t clear from all the choices above is that, along with the Dr. Pepper Snapple Group, the top three firms account for 89% of soft drink sales in the United States.
[via Visual Complexity] [more food and beverage-related infographics from Philip H. Howard at Michigan State University]
The Greatest Show Currently on Earth
This weekend you can go see a movie or go watch a little bit of...