Famous Scientists for $1,000

Earlier this week we looked at the study of culturomics, which takes the frequency of a word’s use in written literature to quantify cultural trends.  Now we’re going to see what can be done with this data on a larger scale, in this case, measuring the impact of scientists.

Here’s the top 20 from the Science Hall of Fame, which includes over 4,000 names from two centuries…

Though the researchers used milliDarwins as the measure of fame for the study, ACM’s favorite, Bertrand Russell tops the list.

To give you a little more perspective on the timelines involved here, check out this video that covers physicists, chemists and biologists and their level of fame by year.  You’ll find plenty of new names worth looking into further…

Speaking of, who was Claude Bernard?  Turns out he was a french physiologist who worked to bring the scientific method to medicine.  First to use the term milieu intérieur (aka homeostatis), let’s close with a quote from him regarding our bodies’ relationship with the external world, which has some interesting relevance to the Ape Con Myth…

The living body, though it has need of the surrounding environment, is nevertheless relatively independent of it. This independence which the organism has of its external environment, derives from the fact that in the living being, the tissues are in fact withdrawn from direct external influences and are protected by a veritable internal environment which is constituted, in particular, by the fluids circulating in the body.

For more on the Science Hall of Fame, you can check out the article from Science explaining their process or go to Gonzo Labs for other materials from the study’s creators, John Bohannon and Adrian Veres.


The Tiny Box Called Today

It’s one thing to live in the present and another to live without a sense of future and past.  If there wasn’t so much going on today, that would be clear.

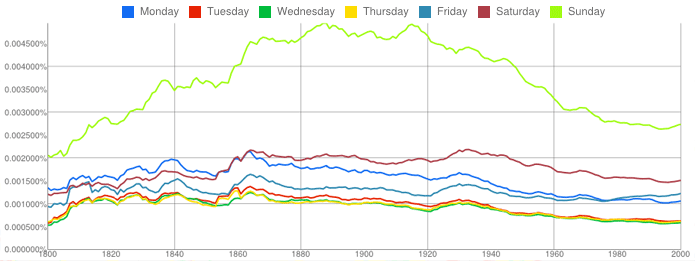
Culturomics attempts to make things clear by analysis of word usage from over five million books going back more than two centuries.  Of all the words people have bothered to write down, how do the days of the week rate?  That’s just one of many questions you can answer with Google’s Ngram Viewer.

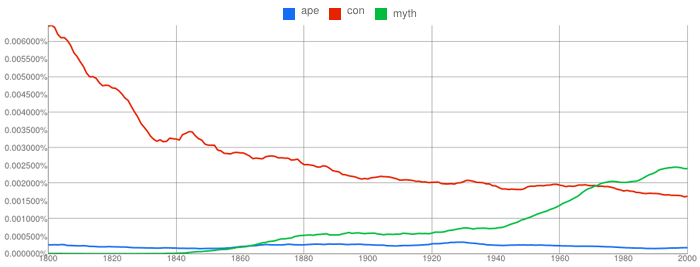
Try ‘ape, con, myth‘ and you find the story of the lowly ape witnessing the slow demise of the con and the rise of the myth.

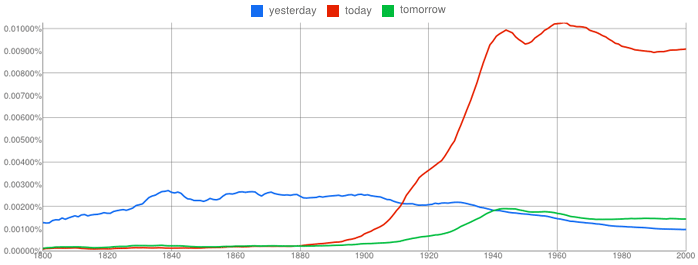
For something more down to Earth, you can found out who is playing second fiddle between ‘peanut butter, jelly’ and ‘beer, wine‘ or check out the historic temporal attitudes of prose writers with  ‘yesterday, today, tomorrow‘…

Turns out today wasn’t such a big deal in the 1800’s.  …  Nor was life expectancy.

If you come up with a good search, please share it in the comments.

What Have You Been Up To?

What do you remember from your day to day?  Can you recall what you did last year, last month or last week?  Nicholas Felton, aka Feltron, knows.  No, he doesn’t know what you did, but he knows exactly what he has been up to and since 2005 has shared the results in the Feltron Annual Report.

For more on the subject, we turn to Roman Mars and the 99% Invisible radio show

Below we have the on-the-ground report of Feltron’s 2008 comings and goings.  Open up his Annual Report archive in a new window to explore while you listen…

(click to jump into the 2008 report)

[Feltron.com via 99% Invisible; Thanks, Timothy!]

Winning What You’re Scared To Go For

Artist: Panda Bear
Song: Comfy in Nautica
Album: Person Pitch 


(Press play and sing along…)

ComfyInNauticaLyrics

If you’re already heard the song or just want more, check out the Strawberry Time Lapse below. Animal Collective just headed back into the studio and to get us in the mood shared an array of glimpses from their time recording Strawberry Jam.

[Lyrics via Lyrical Collective]

U.S. Newspapers in the Fourth Dimension

See how the light spread from sea to shining sea…

(click for interactive map)

Those spots of color are papers in different languages.  Maybe next someone will make one of these where the holdings of the media conglomerates are shaded in by owner.  MediaOwners.com would be a great place to start for such an endeavor.  (Or has it already been done?  Please comment if you know.)

Meanwhile, you can probably follow some of the dots’ comings and goings by cross-referencing this chart of historical U.S. metropolitan area population rankings.

[Map by Stanford University’s Rural West Initiative via visual.ly]

Bikes, and Unfortunate Talk of Death

A short documentary on how bikes had the numbers, lost the ground, but came back for the win in the Netherlands.

According to the checklist in the film, the United States (and most other places) have all the key ingredients to drive change on the issue…

  • cities could not cope with traffic
  • very high number of casualties
  • oil crisis, economic crisis

… but sadly we are often in short supply of the given answer:

  • A will to change

Or, one could argue, time to change.

Since you’re probably already aware of how bad traffic is and of the various financial crises plaguing the world, we are left to deal with the casualties.  Of 113 causes selected for the National Vital Statistics Reports for the United States in 2008, motor vehicle accidents were the single leading cause of death not only for those aged 5-14, but also 14-25.  These are two age groups prone to not dying, accounting for only 1.5% of deaths in the United States during 2008.  And while 400 deaths is a big number for the Netherlands, with 13M in population back in ’71, they blow every percentage out of the water getting that number down to 14.  In 2008, the U.S. toll for kids 14 and under was 1,593, which is thankfully down from 2000’s count of 2,591, though no less of a shame.

This isn’t about getting rid of cars altogether, but carving out a real place for bikes in the landscape.  Bike lanes wedged between lines of moving traffic and parked cars don’t cut it.

[Video via Brain Pickings, plus a great set of bike-related links on MetaFilter]
1 2 3 4 5 8