If you’ve been wondering where all the money is, here’s your answer.
[Money Chart by xkcd via Kottke]
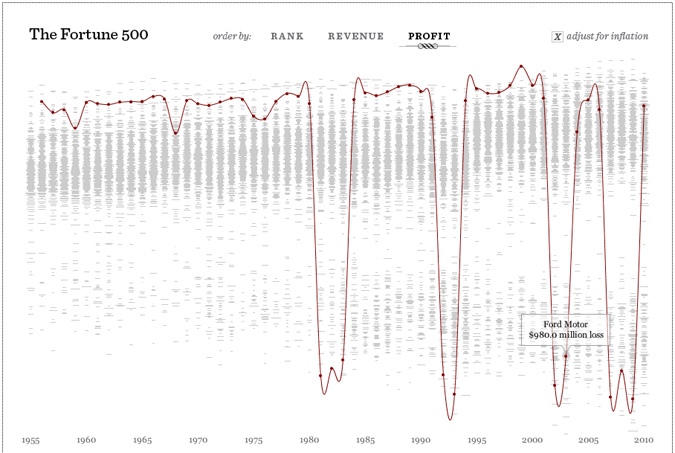
If you’ve been wondering where all the money is, here’s your answer.
[Money Chart by xkcd via Kottke]
As far as charts featuring revenue and profit go, this is about as good as it gets.
 (click the image for interactive Fortune 500 fun!)
Ford is just one of over five hundred stories found in this data set. Clicks and arrow keys will guide you through 55 years of bottom lines for America’s largest corporations. Ford, despite what you see above, spent the majority of the time ranked around #3, never taking the top spot and only falling as low as #8 in 2010.
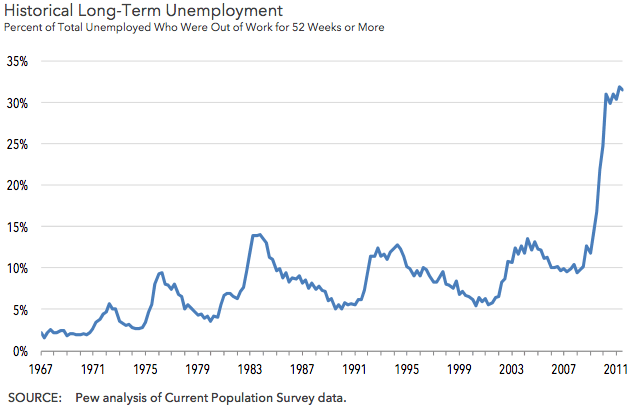
[Chart from Fathom via Flowing Data]Notice the big change since 2007?

That’s over 4 million people jobless for a year or more as of the Q3 2011.
Yet the Dow thinks it’s 2007.
Here’s to keeping expenses low and profits high!
[Unemployment data (PDF) from Pew Charitable Trusts via Infectious Greed, Dow chart from Yahoo!]This is just a reminder that tomorrow, the 5th of November, is Bank Transfer Day.
The idea is to drop your commercial bank and transfer your funds to a not-for-profit credit union.
But what is a credit union, what’s the difference between a bank and a credit union, and why should you bother to change?
Who knows?
This weekend you can go see a movie or go watch a little bit of history play out right in front of your eyes. Actually, there’s plenty of time to do both. You know where the movie theaters are, so here’s a directory of all the places currently being Occupied. Â Somewhere in your town, there’s a good chance some people are out camping in tents to protest… the way of the world.
If you’re still wondering what Occupy Wall Street is all about, here’s an incredible cheat sheet…
(click image to get in close)
We work for the economics of scarcity despite living in a time of plenty. Â At this point in history, competing for the necessities is unnecessary and, as such, barbaric. Â It’s time for corporations to evolve from cyclops with an eye for money to creatures with the depth perception and humanity implied by their personhood. Â We can’t all be the 1%, but there’s no reason their profit motive should dictate or endanger the lives and livelihoods of everyone else.
While you might take issue with any or all of OWS, there’s a 99% chance you’re in the same boat. Â Go meet some fellow passengers.
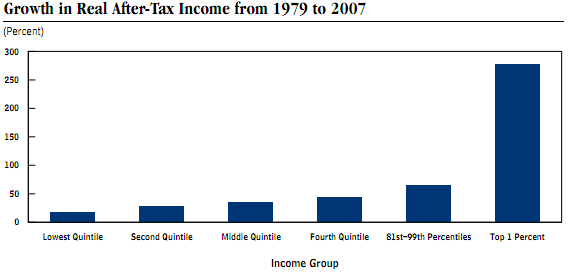
[Chart by Rachel Schragis via Hyperallergic]The Economist gave a nod to the 99% by way of some numbers from the Congressional Budget Office that make you go, “Ouch.”  Those are some tough percentages to defend.

But how do you stop it from being easier to make a lot of money when you have a lot of money?
[graph from the CBO’s Trends in the Distribution of Household Income Between 1979 and 2007 (PDF)]
Next they should do one for the 53%…
[The New Yorker – Oct 24, 2011 cover via /r/occcupywallstreet]Previously Ape Con Myth explored the history of the Dow Jones Industrial Average through the lens of the Tao Te Ching in a project known as The Tao Jones. Given the recent activity in the market, we have returned to that work to seek wisdom, or at least some perspective and an update on a couple of charts…
On day one, May 26th, 1896, the Dow closed at 40.94.
Yesterday, 31,246 trading days later, it closed at 11,236.77.
What happened in-between? Here’s everything:
While there was plenty of drama beforehand, below we zoom into more recent history, starting in 1982 when the Dow left the 1k threshold behind after 18 years of bouncing between 800 and 1,000. Taking the powers of ten as developmental milestones, the Dow is currently working to leave 10,000 in the dust. It first crossed the line on March 29th, 1999. Since then it has recrossed that line 34 times, the last just under a year ago on August 27, 2010.
Don’t be surprised if it has to again.
Yet, all hope is not lost! Although they currently put the Dow around 9,500, Ape Con Myth’s ‘not-to-be-considered-investment-advice’ projections say dawn will break in mid-2013, with 30,000 waiting for us by the end of the decade.
But don’t rush to the end, start at the beginning…
In case you left the office on Friday for a weekend in the woods and are wondering why the sky is falling this fine Monday morn, Standard & Poor’s has downgraded the long-term sovereign credit rating of the United States from AAA to AA+.
(!)
What does it all mean? How did it come to this? As usual, the answer depends on who you ask, which might mean no one really knows, but who would be qualified to say?
The problem with taking this as seriously as one might was summed up by Ezra Klein in the Washington Post:
Standard Poor’s didn’t just miss the bubble. They helped cause it. They were paid by the banks to award their AAA-stamp of approval to all manner of financial products that were anything but riskless — which, ironically, makes them an accessory to the resulting explosion of U.S. debt. You’ve heard the old joke about chutzpah being a young man who murders his parents and then pleads for leniency because he’s an orphan? S&P has chutzpah. All the credit-rating agencies do. It’s built into their business, which requires them to assess the stability of markets they helped crash. It’s long been my position that the credit-rating agency model is broken and, at times, dangerous, and investors need to pay less attention to their pronouncements.
It makes it feel like (bad) theater, or simply a publicity stunt, but so have the actions of the U.S. government, as S&P pointed out:
The political brinksmanship of recent months highlights what we see as America’s governance and policymaking becoming less stable, less effective, and less predictable than what we previously believed. The statutory debt ceiling and the threat of default have become political bargaining chips in the debate over fiscal policy.
Sure, it’s no longer clear who Congress is representing, but S&P shouldn’t be the source of the complaint.
As far as Ape Con Myth is concerned though, the major rating agencies showed their lack of judgment on the day they picked their names, which are all right up there with Okay Cleaners and Three Star Muffler.
Standard – 1b – sound and usable but not of top quality
Poor – 2A – less than adequate
Moody – 2 – subject to moods : temperamental
Fitch – 1 – polecat (any of several carnivorous mammals of the weasel family)
In summation:
Dear Everyone,
If you want theater, hire more playwrights.
Love,
Ape Con Myth
P.S. Perhaps actors should completely replace politicians. They know the rule: The show must go on!
How many people does it take to make the not-so-merry-go-round go round? If you’re talking about the United States economy in 2007, which we are, then the answer is 146,047,000 people, or … wait for it … 48.4% of the population.
Did you think it would be more? Either way, it certainly brings new meaning to the next logical question: How does the other half live?
Let’s look at some basic numbers:
As you would expect, kids and the retired account for much of this other half who magically don’t have jobs, though there are about 50 million working-age wizards out there. It’s interesting to know whether they want a job or not, but isn’t the real question, do they need one?
Meanwhile, ‘Civilian Noninstitutionalized Population’ is one of the creepier ways of speaking about people over 15 years old who aren’t in the military, prison, a nursing home, etc. How about Civilian Labor Force Pool or simply People Who Can Work?
While the Institute for the Study of “Making a living” will continue to explore how the noninstitutionalized do and don’t make ends meet, ACM’s take-away is that it didn’t take everyone to create the world’s largest economy in 2007. The next question is, how many of those jobs were mission critical?
Which mission? We will consider a few.