Making Lemonade from an Old and Somewhat Flawed Chart

Yesterday it was a map, today it’s a chart.

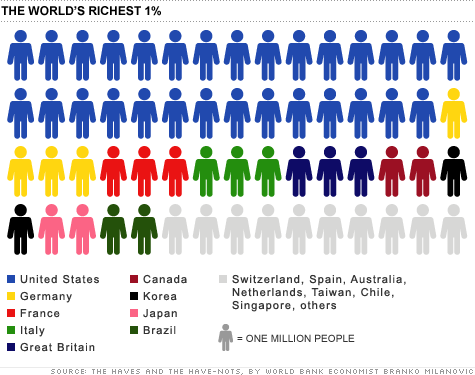
The point of this one is to say that, to be part of the world’s richest 1%, all you have to do is make $34,900 a year, after taxes.

That’s per person by household, of course, so if you’ve got a significant other, double it, and if you’ve got a couple of kids, quadruple it.  It raises the bar a bit, but the big shocker is: 29 million, or almost half, of the world’s richest 1% are Americans, just like you!

Then there’s some other countries, take a look…

Now, this chart was part of an article on CNNMoney only a month ago, but we are told the data is from 2005.  Then you count the little chart people, find only 60, and rightly exclaim, “Hey, we hit 6 billion in 1999.”  For 2005, this chart would need four or five more people depending on which way you round it.  It might not seem like much or that long of a time, but world GDP went from $40B to $60B in the same period.  The question is, how would it change our $34,900 number?

But say you do top that number, then look around your surroundings and rightly exclaim, “Hey, I’m not rich.”  Just read the end of the article, silly.  We’re talking about the entire world here.  The world in which the global median income is $1,225/year. “In the grand scheme of things, even the poorest 5% of Americans are better off financially than two thirds of the entire world.”  …  That’s where the record skips.  If you want to hear some reactions to this conclusion, check out the 1,000+ comments that have piled up.  They range from pointing out the differences in cost of living around the world to accusing the writer of trying to take the heat off America’s 1%.

The disconnect is from measuring richness by income, as opposed to wealth.  Yes, remember wealth.  That’s what you’re missing.  Assets.  Your life should make sense again as soon as you hear that it takes $500,000 of assets to put you into the richest 1% worldwide.

How many little chart people would the U.S. get in this scenario?  37%, or 22 people.  The chart above was only off by 11%, but it completely missed the boat on Japan, which should have 16 people.  Anyway, what about the American 1%?  How much yearly income does it take to get in that club?  Well if you believe CNNMoney, they say it was $343, 927 in 2009, a measly 10 times what they were selling last month.

And before you think they might be trying to show both sides, note that this second article starts out by baiting you with the idea that it would take a million dollar income to be in the top 1%.  Surprise, you only need a third of a million!   Or, 37 times what the poorest 20% of Americans make on average, 14 times the next, 7.7 times the middle, and 4 times the fourth quintile.

As ThinkProgress would love to explain further, the American 1% owns 40% of the nation’s wealth, including 50% of all U.S. stocks, bonds and mutual funds, and takes home 24% of the nation’s income.

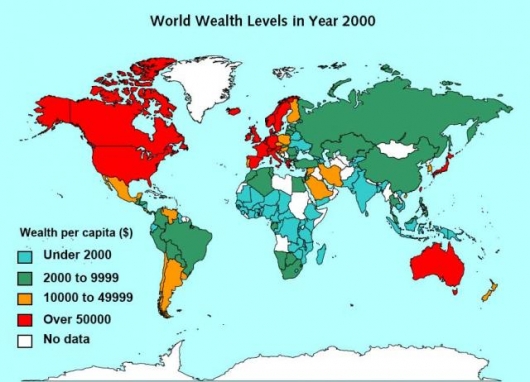
When it comes to world wealth, it looks a lot like yesterday’s map.

And back where we started, the crowd walks away wondering what it was all about anyhow.

[Map from World Institute for Development Economics Research via Gizmag]
Making Lemonade from an Old and Somewhat Flawed Map

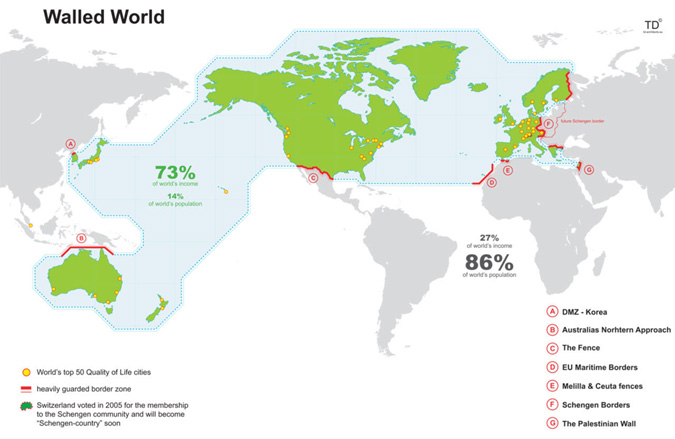
We begin with a map.  A map from TD-Architects, which seems to have a lot of interesting content though remarkably difficult navigation.  A map that might be from 2006 or 2007 (or 2009?).  The source of the income data?  Unknown.

Anyway, the idea of the map is that 73% of the world’s income is being protected on all sides by walls or, as they are called, “heavily guarded border zones” in an effort to create the “greatest wall” ever built on this planet.  Go ahead, take a look…

(click to enlarge)

If you want get into the flaws of the map, reddit has conveniently ripped it apart on multiple occasions, including this 400+ comment thread.  The gist is that “heavily guarded” is an exaggeration, the selections are arbitrary, and there are plenty of wealthy areas outside these borders.  …  But is it still conceptually interesting?

While looking into the income data, it turned out that these countries within the so-called walled world match up with the World Bank‘s list of “High Income” members of the Organisation for Economic Co-operation and Development (OECD).  Since 1973, these countries have made 70-80% of the world’s income year after year, that is until 2006 when their percentage started to drop.  The situation really is changing, and as of 2010 the high income OCEDers were down to 63%, but the map really is a SNapshot Of Globalization, which is what TD’s SNOGs are all about.

Tomorrow we’ll use a somewhat flawed chart to take this a step further.

For more on those walls: DMZ, Australian Defense Force, Mexico-United States barrier, EU Maritime Borders, Melilla & Ceuta border fences, Schengen Area, Israeli West Bank barrier.

For more on the data: The World Bank is offering a killer 200,000+ line spreadsheet full of all kinds of data or if you’re more of a charts person, check it out via Google’s Public Data Explorer.

[Map via Information is Beautiful]

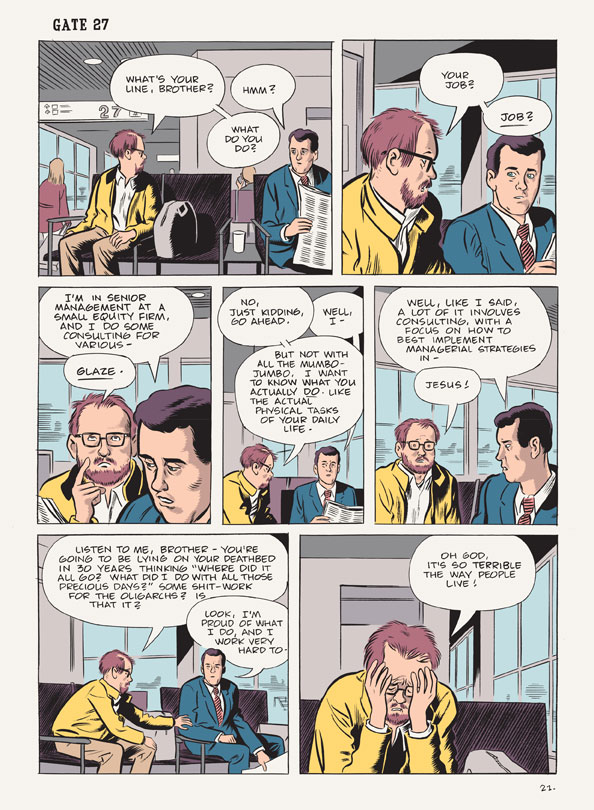
What’s Your Line, Brother?

From Daniel ClowesWilson:

Some Ivy League students are starting to agree with the sentiment after watching so many of their peers head off to work in consulting and finance after graduation.  From All Things Considered’s Stopping the ‘Brain Drain’ of the U.S. Economy

Student protesters recently got into a Goldman Sachs recruitment session at Princeton University to tell student attendees they were listening to a “carefully crafted recruitment pitch” and that they could “do better for society.” Similar protests have been held at Harvard University, and at Stanford University, where Teryn Norris was a student. …

“The problem is that when you’ve got 20 to 30 percent of some of the top talent in this country going into a sector that is not necessarily contributing to economic and social productivity,” he says. “That’s a problem for the country at large and it’s something that we should all be concerned about.”

Economist Paul Kedrosky agrees, except that we’re about two decades late in getting concerned.  He believes the current financial morass is the work of a long line of bright minds who decided to spin their wheels in the name of money, as opposed to areas like science, engineering and mathematics, a.k.a. the subjects many of them actually studied in school…

[Wilson is available from Drawn & Quarterly; NPR story via Hacker News]

COICA. PIPA. SOPA. ACTA. TPP. Stop.

You know how in the movies the good guys have an initial victory, then the bad guys come back worse than ever, but though the odds are outrageous the heroes come back in the end with some insane plan to save the day?  Well, that’s what is happening this Saturday, February 11th.  Where?  Everywhere!


View ACTA Protests Worldwide – Brought to you by stoppacta-protest.info in a larger map

Who are the good guys and bad guys again?  To translate from above, the internet had an initial victory with the PIPA & SOPA copyright bills in the United States, but now there’s all kind of secret shenanigans going on internationally to push through trade agreements with the same absurdly overreaching copyright and intellectual property provisions as SOPA, just this time on a global scale.  For this round, the response is being led in Europe as the EU has not yet ratified ACTA.  The action, however, will be happening worldwide, with over 200 cities planning protest events.

In case you haven’t been keeping score, this is how the saga has progressed:

1 – COICA, Combating Online Infringement and Counterfeits Act – S.3804 – [Wikipedia|Bill Text] 2 – PIPA, or Protect-IP, Preventing Real Online Threats to Economic Creativity and Theft of Intellectual Property Act – S.968 – [Wikipedia|Bill Text] 3 – SOPA, Stop Online Piracy Act – H.R.3261 – [Wikipedia|Bill Text] 4 – ACTA, Anti-Counterfeiting Trade Agreement – [Wikipedia|Text] 5 – TPP, Trans-Pacific Partnership – [Wikipedia|Text]

The timeline is the most shocking part.  COICA was introduced in September of 2010.  In 17 months, the entertainment industry and its faithful servant, the United States government, have managed to get three pieces of legislation shot down by overwhelming public opposition, yet still had the time and the nerve to try to get their way by bypassing every democracy on Earth.

In the U.S., Obama has already signed us on to ACTA, although that doesn’t mean it will stick.  As Digital Commons explains it, “The problem is that the President lacks constitutional authority to bind the U.S. to the agreement without congressional consent; but that lack of authority may not prevent the U.S. from being bound to the agreement under international law.”  Then again, Obama might be left holding the bag on this one, as Poland and the Czech Republic have now suspended their ratification of ACTA and the European Parliament is about to get an earful encouraging them to not even bother.

Now back to the movies.  Yes, you’ve already had to hear and do a lot about this crap, you’re tired, it’s Friday and you want to go home, but we can’t walk away yet.  There would be no entertainment industry if the heroes never finished the job.  Go ask a focus group.  We’ve got to see this through and it is going to require a little more effort.

What can you do?  Once again, Fight for the Future has everything you need at KillACTA.org.  Join in one of the events mapped above, sign the TPP petition and don’t hang up your spurs until you write your representatives about ACTA, which you can take care of right here, in Brainerd…

From KillACTA.org:

Stop ACTA & TPP: Tell your country’s officials: NEVER use secretive trade agreements to meddle with the Internet. Our freedoms depend on it!


For European users, this form will email every MEP with a known email address.
Fight For The Future may contact you about future campaigns. We will never share your email with anyone. Privacy Policy

Here’s to happy endings!

BFFs: A Look Through the Fannie Maze

In 2008, two institutions with profoundly unfortunate names were taken over by the federal government.  Known as Fannie Mae and Freddie Mac, they owned or guaranteed half of the entire U.S. mortgage market at the time and their subsequent rescue represented “one of the most sweeping government interventions in private financial markets”… “in decades”.

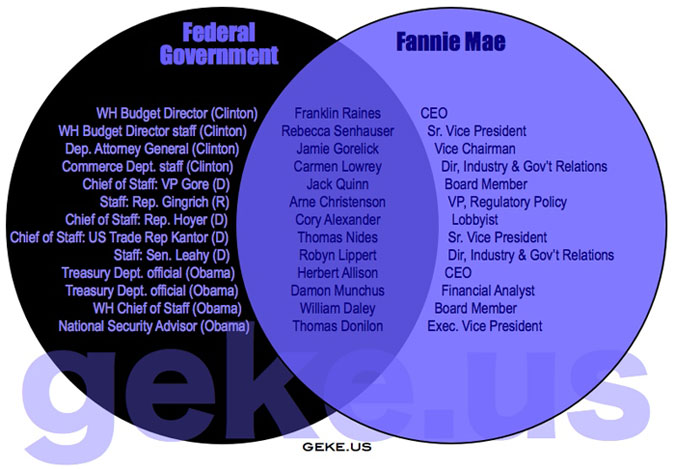
Who were the captains of this Titanic?  Who let them behind the wheel?  Though not the most glamorous of posts, as government-sponsored enterprises, they were unsurprisingly stocked with people who were in the government.  Below we have a venn diagram (one from a larger set created by geke.us) showing a selection of people from both sides of the fence equation.

(click for venn diagram collection)

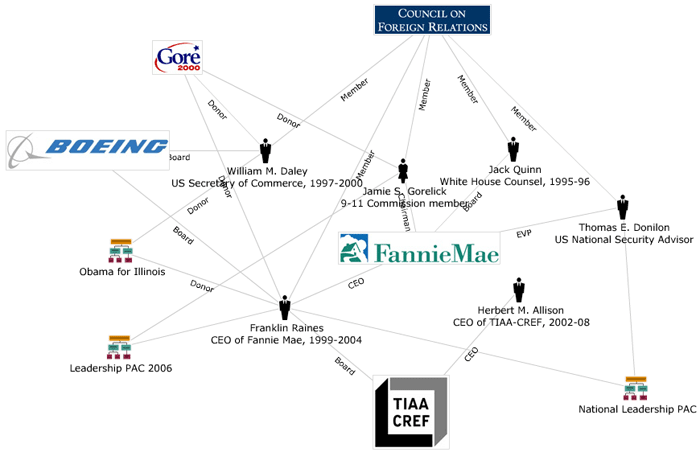
That’s the tip of the iceberg though.  Let’s see who on this list comes up in the NNDB Mapper, a very fun tool for mapping the links between people, companies and events ranging from Rihanna to the Funeral of Richard Nixon.

(click for NNDB interactive version)

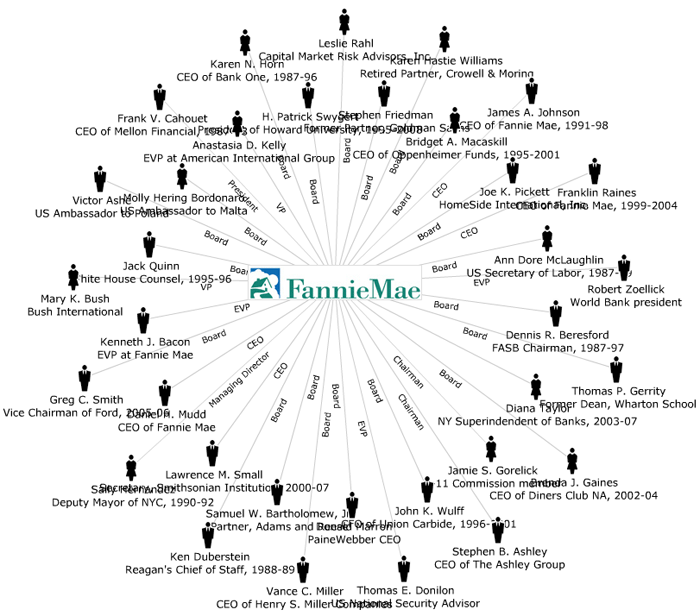
Okay, we got 6 out of 13.  Above we have the connections they share.  Now let’s look at everyone associated with Fannie Mae.

(click for NNDB interactive version)

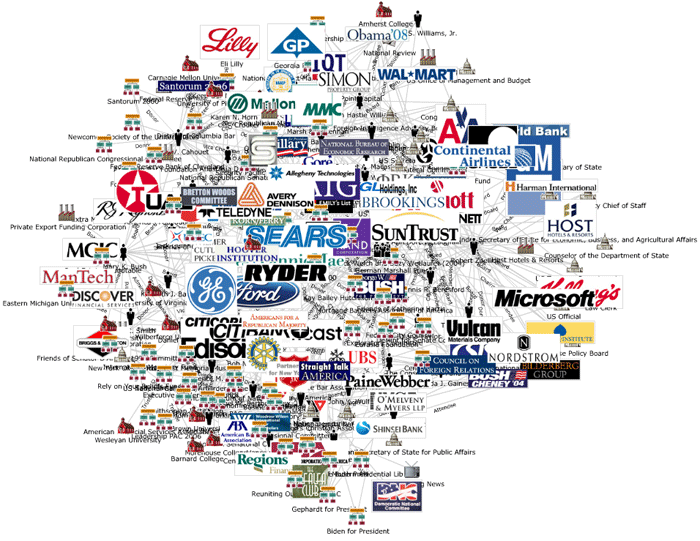
Mainly board members and CEOs.  But what happens if we blow out all of their nodes?

(click for NNDB interactive version)

We get a picture.  A picture of the myriad influences and connections that led to a spectacular failure.

The End.

[Venn diagram via Infoplasm]

Christmas in China (or It’s All a Blur of Red and Green)

China’s color might be red, but the only reason you hear it mentioned so often these days is because of the green.  For all the talk of China though, what do you really know about the country?  …  Aside from the population, censorship, poor working conditions and growing unrest.

This is obviously a gigantic topic, so we’ll begin by pulling together a few pieces regarding its political structure and leadership:

We start, complexly enough, with a nation of 1.3 billion people.  How many are in the Party?  80 million, or a little over 6% of the population.  (For comparison, Buddhists are estimated to include 50-80% of the populace, with Taoists around 30%.)  What are the perks of being a card carrying member?  Better jobs, better schools, and better …  wait for it… information!

As the BBC’s chart below shows us, that 80 million boils down very quickly to the 23 men and 1 woman who make up the Politburo, though they go on to say that the real power lies with the 9 members of the standing committee within it.


(click for BBC feature)

The BBC gives summaries on each segment, but the highlights include a National People’s Congress that only meets once a year, party elders who don’t go away, and the State Council, which “sits at the top of a complex bureaucracy of commissions and ministries and is responsible for making sure party policy gets implemented from the national to the local level.”

Or perhaps your eye was drawn to the Discipline Commission, originally established as the Central Control Commission and now officially known as the Central Commission for Discipline Inspection.  Charged with rooting out corruption in the party, you can decide for yourself whether you want to be the fifth person to like them on Facebook.

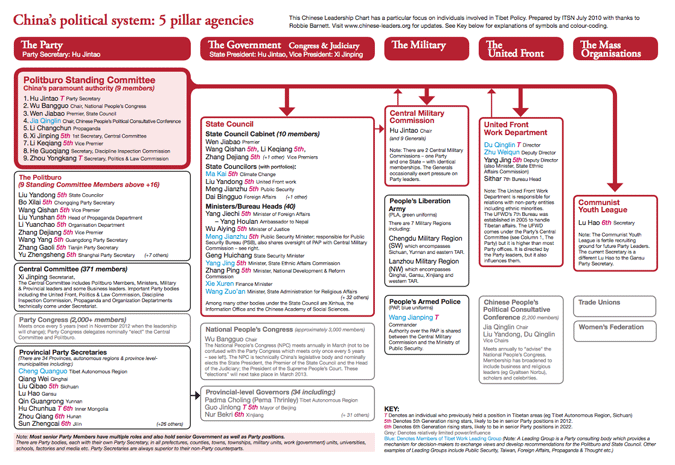
From there, we go to the names behind all these political bodies via a chart from The International Tibet Network:

(click to enlarge)

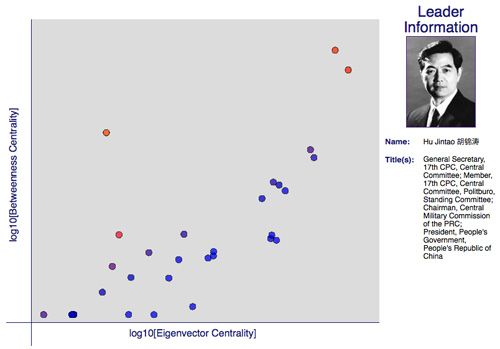
Don’t recognize many names?  Then try out Drew Conway’s interactive chart below, showing the most connected and critical members of China’s top brass going into 2012.

(click for interactive chart)

This year the fifth generation of Chinese leadership is expected to transition into power, with Xi Jinping likely to replace Hu Jintao as General Secretary and President.  While the fifth will be preoccupied with China’s economy, it is speculated that the sixth generation, born in the 1960’s, will be the source of significant political reform after their rise to power in 2022.

As for all the green, the Wall Street Journal is keeping score here: China Econtracker

[Charts from the BBC’s How China is Ruled, The International Tibet Network’s Chinese-Leaders.org, and Zero Intelligence Agents]

Fracking, Not Frakking

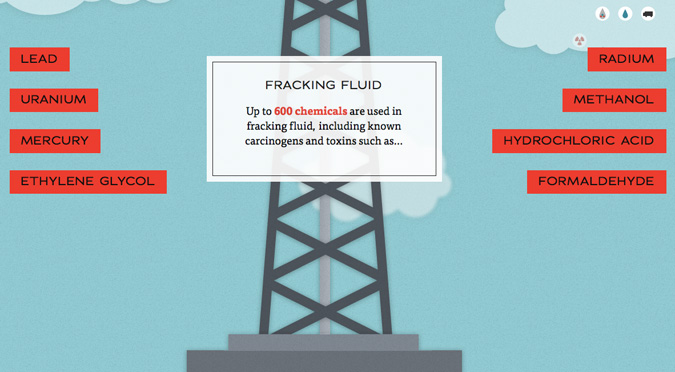
The kids are always talking about propagating fractures in rock layers to release the natural gas trapped underneath, but what is “fracking” all about?  Thankfully someone has made a beautiful website to quickly walk you through the entire process…

Why should you care?  Because fracking got an exemption in the Safe Drinking Water Act, despite the hazardous stew it leaves underground.  Also, there already happens to be bills stagnating in Congress to take the exemption away.  Let’s go ahead and take care of this very specific little oversight.  Go direct to taking action here or enjoy Linda Dong‘s site, Dangers of Fracking, which will take you to the action and further resources at the end.

[via Daring Fireball]

Compete with Ape Con Myth to Click Your Life Away!

When you boil down a lot of online games, you are basically being rewarded for clicking the screen over and over again.  Not that there is anything wrong with it necessarily, so long as you know what you are doing.  The people making the games know.

The unknown forces behind Click Your Life Away know too, but were kind enough to spare you the cute design, shallow story lines and incessant baiting to buy-in.  The object here is to click in the box, and Ape Con Myth wants to take you on!

The contest?  Click as many times as you can.  The stakes?  Whoever is in the lead Friday, February 10th at 5pm PST wins a free Ape Con Myth t-shirt.  Contest entry will be tracked in the comments, so please include your email and tell us your username* if you want to win.  ACM has started a new account for the occasion, so don’t worry, you’re not already 5,000 clicks behind.

WARNING:  Refresh the page if you let it sit for a while!!!  It WILL have logged you out, but pretends to still be keeping score.  Otherwise, it’s as simple as it goes.  Good luck!

[*Work “ape” into your username for non-redeemable style points.]

Winning What You’re Scared To Go For

Artist: Panda Bear
Song: Comfy in Nautica
Album: Person Pitch 


(Press play and sing along…)

ComfyInNauticaLyrics

If you’re already heard the song or just want more, check out the Strawberry Time Lapse below. Animal Collective just headed back into the studio and to get us in the mood shared an array of glimpses from their time recording Strawberry Jam.

[Lyrics via Lyrical Collective]

Hungry, Hungry Hippos (or Banking Mergers 1990-2009)

From Mother Jones:

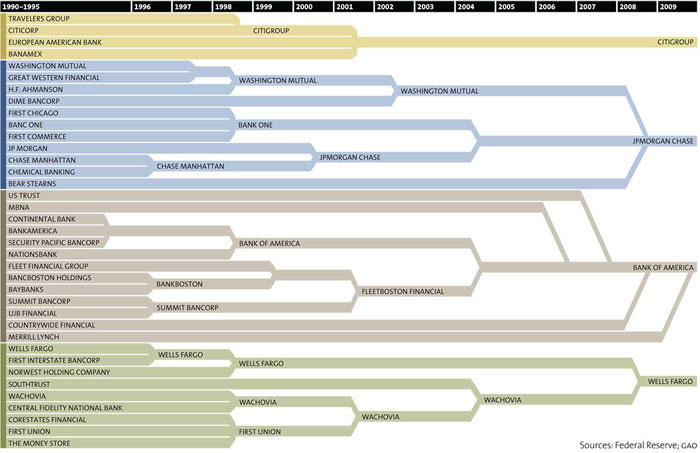
The nation’s 10 largest financial institutions hold 54 percent of our total financial assets; in 1990, they held 20 percent. In the meantime, the number of banks has dropped from more than 12,500 to about 8,000. Some major mergers and acquisitions over the past 20 years:

big-bank-theory-chart-small(click to enlarge)

It might look like a sports bracket, but competition requires competitors and 33 of these players aren’t coming back next season.  The object is to best other companies, not eat them.

For a similar look at the investment banking game, see the New York Times’ Wall Street Vanishing Act chart.

[Chart from Mother Jones via /r/Economy]
1 11 12 13 14 15 16 17 41