Twin Peaks: The Tibetan Method
Wasted URLs: California.com

[via California.com]
2007 California GDP
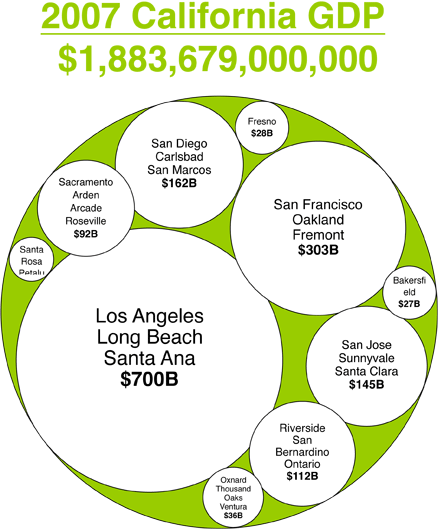
[Data via Bureau of Economic Analysis: State GDP, Metro GDP]
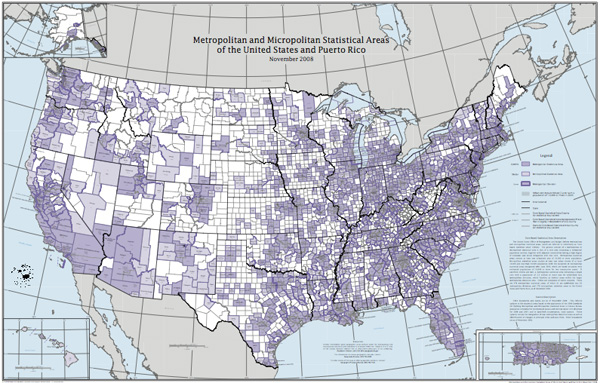
Statistical Areas of the United States
Core Based Statistical Area Description: “The United States Office of Management and Budget defines metropolitan and micropolitan statistical areas, which are referred to collectively as “core based statistical areas” (CBSAs). The general concept of a metropolitan or micropolitan statistical area is that of a core area containing a substantial population nucleus, together with adjacent communities having a high degree of economic and social integration with that core. Metropolitan statistical areas contain at least one urbanized area of 50,000 or more population. Micropolitan statistical areas contain at least one urban cluster of at least 10,000 and less than 50,000 population. CBSAs are composed of entire counties. There are 374 metropolitan statistical areas, of which 11 are subdivided into 29 metropolitan divisions, and 579 micropolitan statistical areas in the United States and Puerto Rico, as of November 2008.”
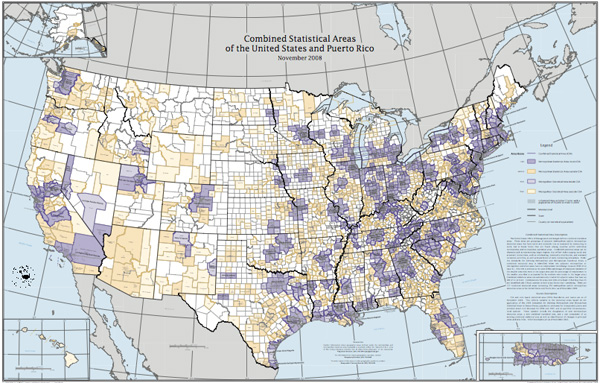 (click for enlarged Census Bureau versions)
[U.S. Office of Management and Budget home; Wall map versions available via U.S. Census Bureau; more Statistical Area info here (MSA) and here (CBSA)]
Which Reality Do You Subscribe To?
What do Americans think about the union battle going on in Wisconsin? … What do Americans know about public sector unions might be a better question, but for now let’s take a look at the polls and how they are being dished out.
The New York Times headline for the New York Times/CBS News Poll:![]()
“Americans oppose weakening the bargaining rights of public employee unions by a margin of nearly two to one: 60 percent to 33 percent.”
Gawker’s headline for the same poll:![]() … That seems reasonable.
… That seems reasonable.
The USA Today headline for the USA Today/Gallup Poll:
![]() “The poll found 61% would oppose a law in their state similar to such a proposal in Wisconsin, compared with 33% who would favor such a law”
“The poll found 61% would oppose a law in their state similar to such a proposal in Wisconsin, compared with 33% who would favor such a law”
Daily Kos’ headline for USA Today/Gallup Poll:
 Overwhelming? … USA Today might not completely agree, since they also ran the following headline for the same poll:

The Pew Research Center headline for the Pew Research Center poll:
 “Roughly four-in-ten (42%) say they side more with the public employee unions, while 31% say they side more with the governor, Scott Walker”
CNN’s headline for the Pew poll:

The Zogby International headline for the Zogby poll:
![]() “Two-thirds of likely voters agree that state legislatures have the authority to cut state employee salaries and 52% agree they can void collective bargaining agreements to reduce spending.”
“Two-thirds of likely voters agree that state legislatures have the authority to cut state employee salaries and 52% agree they can void collective bargaining agreements to reduce spending.”
Do state legislatures have the authority to cut and void? Did they mean to ask a state government expert that question? And if a survey respondent thinks they do have the authority, does it follow that they support anything? Newsmax thinks so:
![]() And finally, the Rasmussen Reports headline for the Rasmussen Reports poll:
And finally, the Rasmussen Reports headline for the Rasmussen Reports poll:
 “A new Rasmussen Reports national telephone survey finds that 48% of Likely U.S. Voters agree more with the Republican governor in his dispute with union workers.”
The National Review headline for the Rasmussen poll leaves the question open:
![]() Unfortunately the questions don’t stop there. While it makes sense that another polling organization might question a rival’s methods, as the New York Times blog Five Thirty Eight did:
Unfortunately the questions don’t stop there. While it makes sense that another polling organization might question a rival’s methods, as the New York Times blog Five Thirty Eight did:
 … they are not alone in second-guessing Rasmussen. Media Matters has compiled a list of media outlets who have run with it anyway:
 Of course, with Google News showing over 5,000 articles related to the mess in Wisconsin, this compilation could take innumerable shapes itself. Grains of salt should be taken everywhere.
In the end, it all comes back to you and the reality you subscribe to…
[All headlines link to the original articles.]
2007 California Population
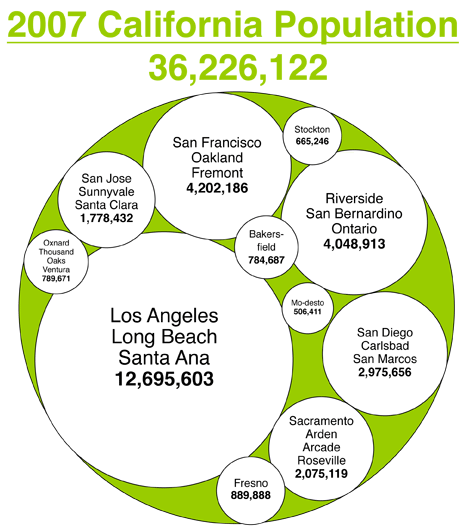
[Data via U.S. Census Bureau: State Pop, Metro Pop]
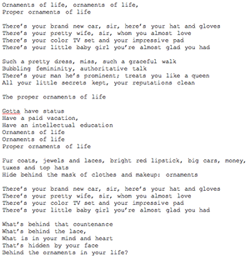
The Proper Ornaments
| Artist: The Free Design Album: Kites Are Fun Song: The Proper Ornaments |
(Press play and then click on the lyrics below to read along)
[The Free Design – Official Site]
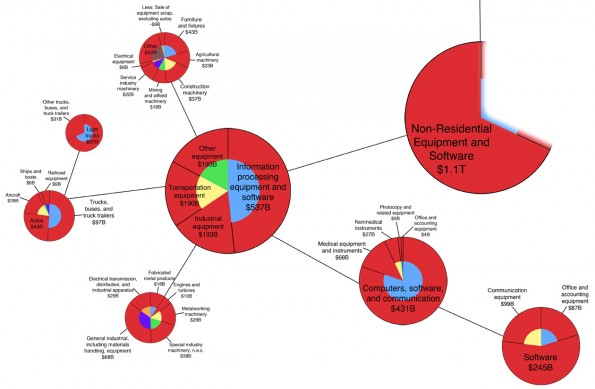
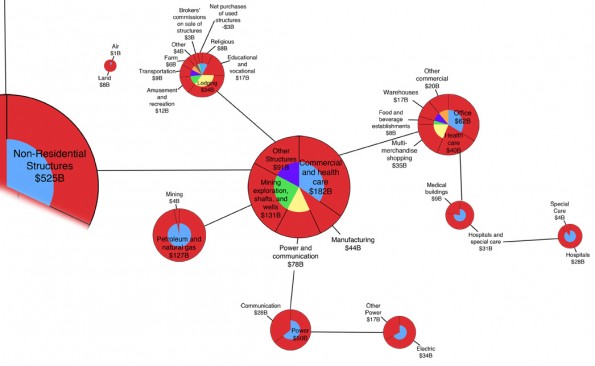
Non-Residential Private Investment
Carl Sagan’s Cosmic Calendar
BEA Economic Areas
“BEA’s economic areas define the relevant regional markets surrounding metropolitan or micropolitan statistical areas. They consist of one or more economic nodes – metropolitan or micropolitan statistical areas that serve as regional centers of economic activity – and the surrounding counties that are economically related to the nodes.”
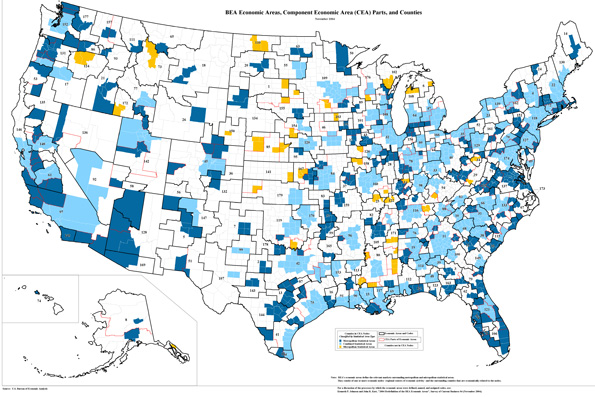 (click for BEA’s enlarged version)
Annual income data by area for 1979-2008 can be found through the BEA’s interactive Bearfacts map.
[Map via Bureau of Economic Analysis]

