How to Plan Your Old School European Vacation

Perspective…  we can’t get enough of it.

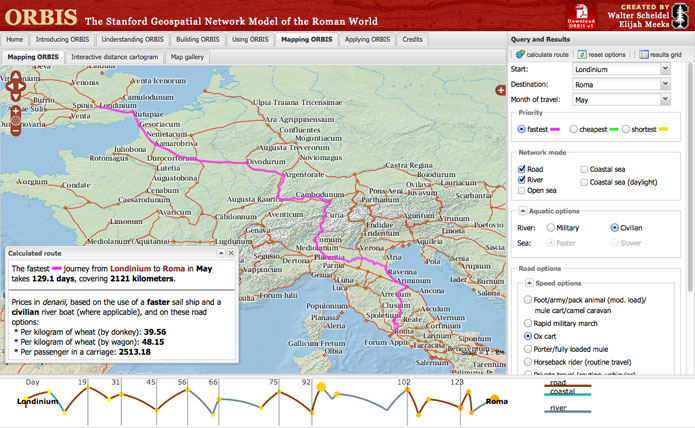
For instance, how long would it take to get you and your ox cart from London to Rome back in the days when they were called Londinium and Roma?  Those up for such a quest should get acquainted with ORBIS, The Stanford Geospatial Network Model of the Roman World:

Spanning one-ninth of the earth’s circumference across three continents, the Roman Empire ruled a quarter of humanity through complex networks of political power, military domination and economic exchange. These extensive connections were sustained by premodern transportation and communication technologies that relied on energy generated by human and animal bodies, winds, and currents.

(click image to explore)

See you in Alexandria!

[via Ars Technica]

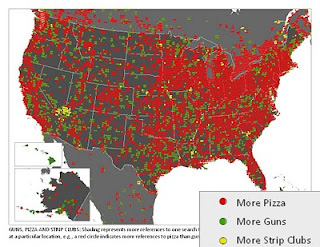
More Pizza, More Guns, More Strip Clubs

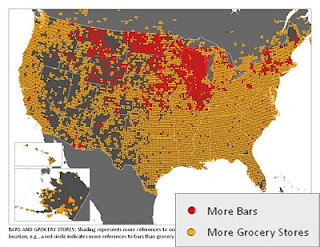
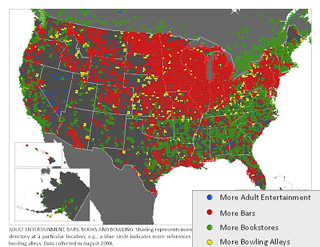
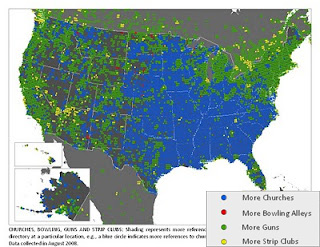
There’s probably a perfectly reasonable explanation behind every one of these data points, aside from paying customers, but until someone figures them out, enjoy generating your own theories about this collection of maps from Floating Sheep.  Each shows the prevalence of various public venues in the landscape of American culture based on results from the Google Maps directory.

Click the map for a larger version, click the match-up for the original Floating Sheep post:

[Bars vs Grocery Stores] [Adult Ent vs. Bars vs. Books vs. Bowling]
[Pizza vs. Guns vs. Strip Clubs] [Church vs. Bowling vs. Guns vs. Strip Clubs]

Find more maps and fun at Floatingsheep.org.

Great Think Tanks Steal

posted in: Ape Con Myth, Maps 0

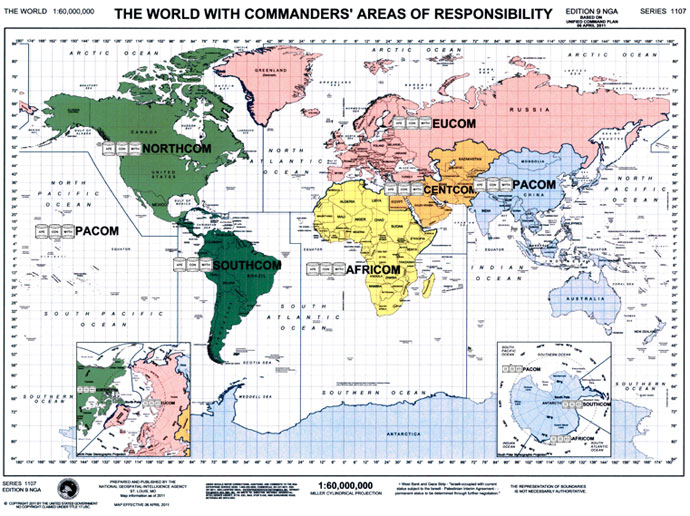
The greatest danger within a think tank is, quite naturally, thinking too much.  Thought goes into the smallest of details on this site and even a simple post can be laden with layers.  Yet there’s only so much time and oh so many things that could use more thought.  … Or so one might think.

To keep things on track, Ape Con Myth seeks to utilize the work of others as much as possible.  The basic idea of this organization is that humanity already has all the answers it needs and, if anything, our job is merely to find and put together the pieces of our collective puzzle.

So, when someone has already broken down the world into manageable chunks, particularly when that someone is the U.S. Department of Defense, well, that’s one thing less to do.

We will need better patches though.  Any volunteers?

Got Water?

posted in: Ape Con Myth, Maps 0

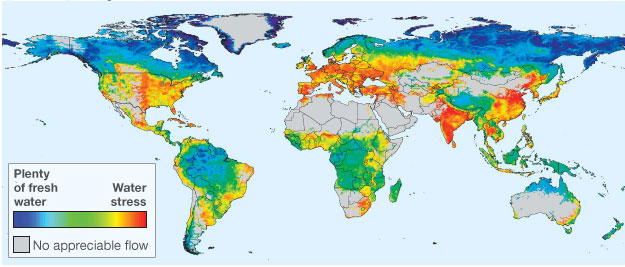
Without the water management schemes we’ve implemented, such as dams, pipelines and other means of securing water supplies, this is what the state of water security in the world would look like…

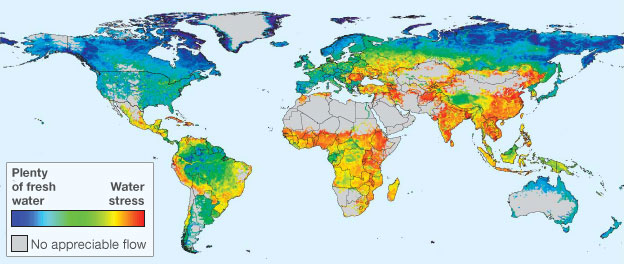
Aside from India and China, whose situation doesn’t improve much in the next example, the “natural” picture above does not look so great for the United States and much less so for Europe.  Yet below, when we look at the “managed” state of things, the U.S. and Europe are shored up while the tables are turned for the worse in Africa.

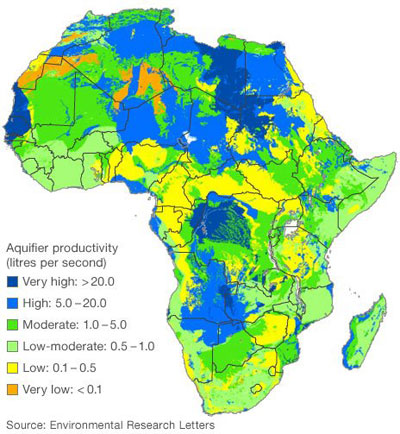
Unsurprisingly, it’s the lack of money in poorer nations perpetuating the lack of water.  (That and the notion that they should be more environmental sound about their improvements, unlike in developed countries where water security often comes at the cost of nature in general.)  There is, however, some good news for Africa.  A new study has revealed a huge reservoir of groundwater totaling over 100 times the volume of water found above ground.  The catch is it’s not a renewable source, as these aquifers were last filled over 5,000 years ago.

The key will be using these hidden resources to cover deficiencies in the short term while sustainable solutions for the future are put into place.  It doesn’t sound like the best job to give to humans, but so it goes.  To complicate matters worse, who knows what the picture will look like as climate change continues to usher us into the unknown.  If all of our efforts so far have still left 80% of the world’s population with an insecure supply of the one liquid we can’t live without, <insert smart-ass comment about priorities without using the word ‘stupid’>.

[World/Africa maps via BBC (Thanks, Paul!); Water security study from Nature, African groundwater study from IOPscience]

We’ll Get to the Pirates Later

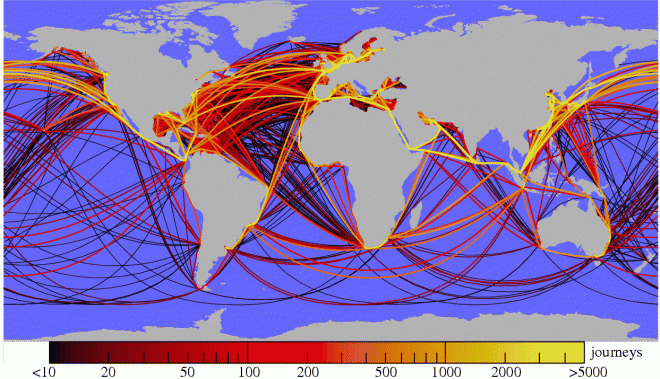
Last week we looked at world trade from the angle of who and what.  This week we consider part of the how.

First, a little perspective on shipping by way of Spanish, Dutch and English routes from 1750 to 1855.  Each line represents a voyage based on the ship’s log book.

How do we roll float these days?  As you might guess, we’re not so much for the squiggly lines anymore.

[Video from Sapping Attention via kottke, Map by Bernd Blasius via Wired]

The State of Corruption (or The Barn Door is Open)

Will there be a point before the robots take over when we elect machines to public office?

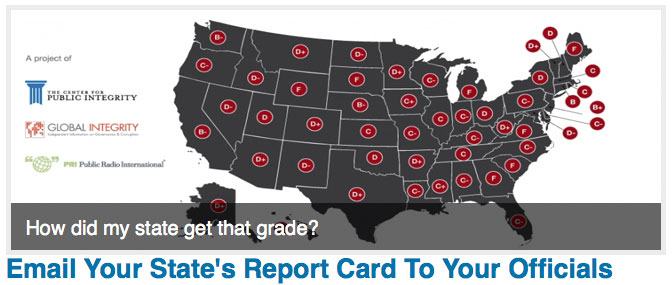
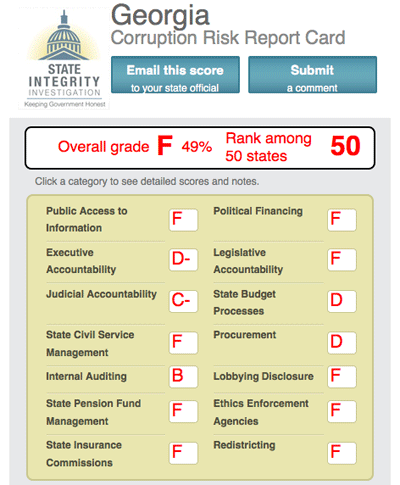
Consider the question again after looking at The Center for Public Integrity‘s Corruption Risk Report Card for state governments in the U.S….

Who would get the job with a transcript like that?  Unfortunately, those are the jobs’ ratings!  Now, fill the role with a human, factor in that power tends to corrupt and how power without status can produce worse results.  Where are our expectations now?

The Center for Public Integrity’s plan is to bring attention to the specific risks of corruption and move along the slow process of reform.  They’ve already helped accelerate efforts in five states and have set it up so you can help do the same in yours.

Check out your state’s results and click to send them on to your representatives so they know you know they know, you know?

Where the Trees Are

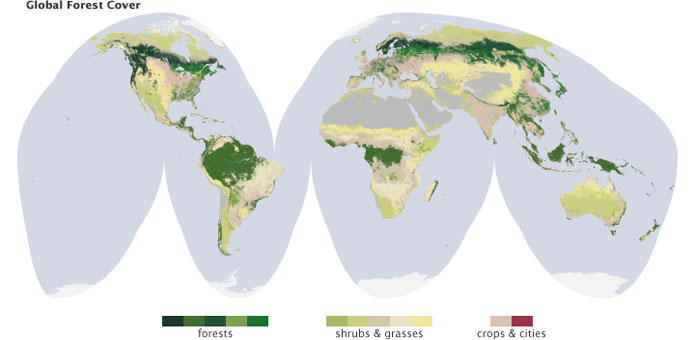
Trees.  They’re great, until they’re in the way.  Forests once covered half the land on Earth and now claim less than a third of it.  Why might we care?  Here’s NASA with a few reasons:

Trees cool and moisten our air and fill it with oxygen. They calm the winds and shade the land from sunlight. They shelter countless species, anchor the soil, and slow the movement of water. They provide food, fuel, medicines, and building materials for human activity.

Modern life is great at detaching us from our natural surroundings.  While the paragraph above contains words like ‘oxygen’, ‘soil’, ‘water’, ‘food’, ‘fuel’ and ‘medicine’, which on The $100,000 Pyramid could elicit “Things Critical To Human Life”, it still doesn’t necessarily make the connection.  We know we need trees.  That’s why we’re using them.


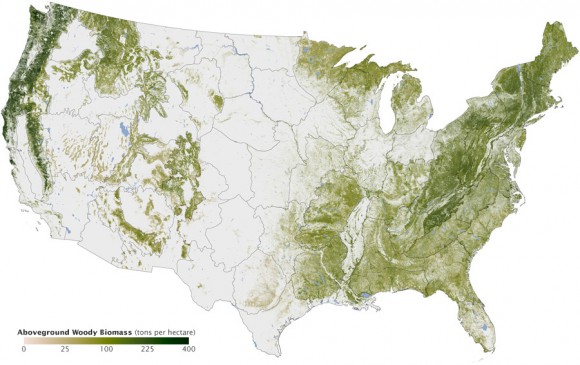
Thanks to a six year collaboration between the Woods Hole Research Center, the U.S. Forest Service and the U.S. Geological Survey, we now have very detailed knowledge of the state of biomass in the United States.  4 pixels per acre to be exact…

(click for much larger image)

It’s good someone is paying attention.  Don’t think for a second we couldn’t chop every one of them down.  (Think buffalo.)  Now with the tree inventory, we’ve hopefully got what we need to carve out a future without it falling down all around us.

[Maps from NASA 1, 2, 3 via Geek.com]

“Yyouu hhave ssaidd itt!”

posted in: Maps, Smog 1

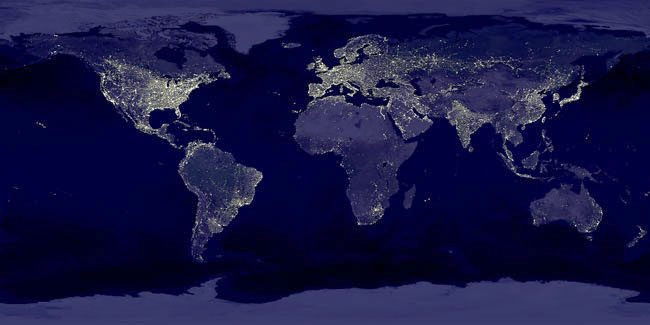
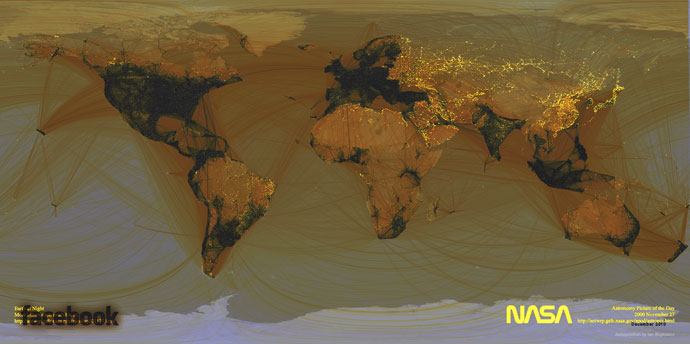
What would it look like if you took NASA’s Earth at Night image


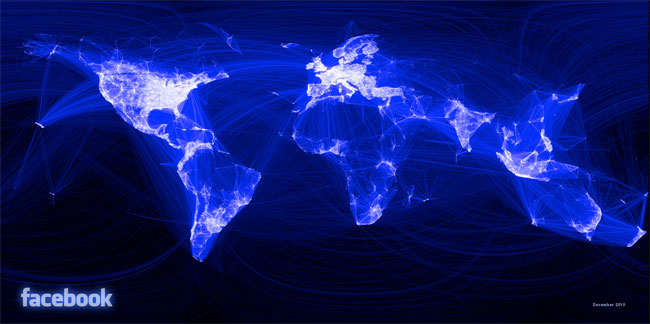
…and subtracted Facebook’s Friendship Map?


Artist Ian Wojtowicz has the answer with his UnFacebook World Map.  Click the image for the enlarged version, which is quite beautiful.

Suddenly the first world is covered in darkness.  Darkness from the shadows of a walled garden?  It kind of looks like The Black Thing from Madeleine L’Engle’s A Wrinkle in Time

“But what is it? Calvin demanded.  “We know that it’s evil, but what is it?”
“Yyouu hhave ssaidd itt!” Mrs. Which’s voice rang out.  “Itt iss Eevill. Itt iss thee Ppowers of Ddarrkknesss!”
“But what’s going to happen?” Meg’s voice trembled.  “Oh, please, Mrs. Which, tell us what’s going to happen!”
“Wee wwill cconnttinnue tto ffightt!”

While that is an overly dramatic and alarmist way to look at it, it will be interesting to see what happens when Facebook goes public and their first concern becomes their new, overly excited shareholder’s expectations that a great deal of money can be made off of all these friendships.  …  No, just kidding.  Facebook isn’t monetizing friendship, just your life.

Don’t forget to Like Ape Con Myth on Facebook!

[Maps via/by Ian Wojtowicz via The Atlantic; UnFacebook World Map poster]

(If Only These Were) International Pony Ride Statistics

posted in: Ape Con Myth, Maps 0

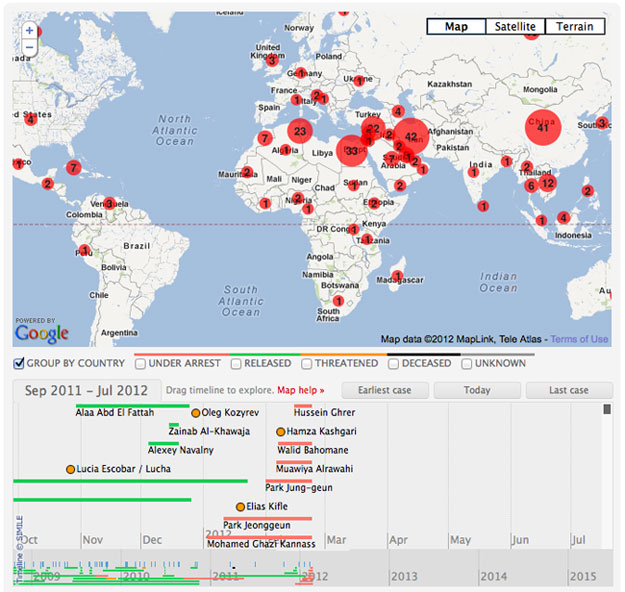
It’d be a wonderful thing if the numbers in the little red dots below were instances of ponies at birthday parties last weekend.  But no, Iran does not currently have 42 exceptionally happy children on its hands.  Those are the number of bloggers and other internet users who have been threatened, arrested or worse for their activity online.  Or at least, the known cases…

(click for interactive tracker)

The Threatened Voices tracker is a new project from Global Voices and EFF to raise awareness of Bloggers Under Fire.  From EFF:

As activists and ordinary citizens around the world are increasingly making use of the Internet to express their opinions and connect with others, many governments are increasing their surveillance and censorship capabilities and taking legal or extrajudicial actions against bloggers and social media users.

While journalists often have a newspaper backing them, not to mention a more professional sounding title, bloggers can quickly find themselves standing alone with their laptops.  The United States might have taken a dive in the latest Press Freedom Index, but there are 130 other countries where conditions are far worse for those who speak out.

To learn more about what’s happening, check out Global Voices for profiles on individual bloggers and EFF for coverage of their cases.

You knowing is half the battle.

Manipulation of Representation

As Congress continues its six-month streak with 80%+ disapproval ratings, it is unfortunate that we can’t look to the current Congressional redistricting, based on the 2010 census data, for hope.  ProPublica has some excellent coverage of the various forces moving these lines around and, just as in Congress, neither of the two parties are setting a good example.

Speaking of, it should only take one to whet your appetite for more.  Take it away, Florida!

From ProPublica:

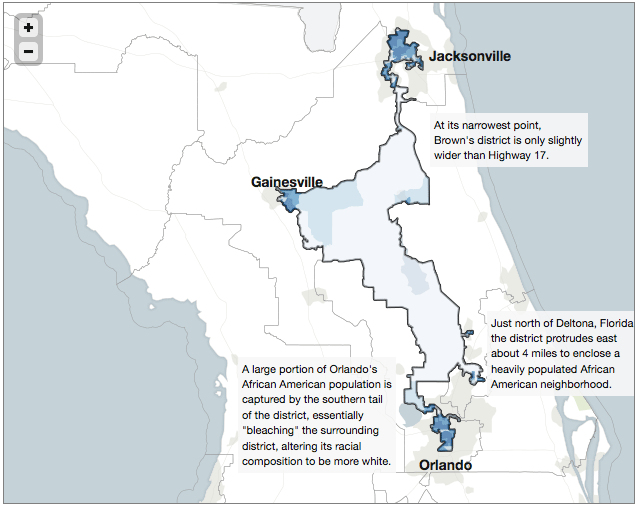
Florida’s 3rd Congressional District scoops African-American neighborhoods out of three cities to form a district that has mostly swampland in between. Districts like this one, created in the 1990 redistricting cycle, helped African-American congressional candidates win historic victories. But the districts surrounding it are now much whiter, and thus more Republican, than ever before. Many credit the 1990 redistricting with turning Florida from a blue state to a red state.

(click image for related article and more maps)

That is sadly just the beginning. ProPublica will walk you through examples of the various brands of gerrymandering currently in use in the U.S. and the names alone (cracking, packing, bleaching, hijacking and kidnapping) will give you the general drift. If that doesn’t make you sick enough, Slate has a slideshow featuring 21 of the most gerrymandered districts.

For more on the current 2010 process, check out the Rose Institute for news and info by state and the Purdue University Library for a full collection of official government redistricting sites.

[Map from ProPublica]

Making Lemonade from an Old and Somewhat Flawed Chart

Yesterday it was a map, today it’s a chart.

The point of this one is to say that, to be part of the world’s richest 1%, all you have to do is make $34,900 a year, after taxes.

That’s per person by household, of course, so if you’ve got a significant other, double it, and if you’ve got a couple of kids, quadruple it.  It raises the bar a bit, but the big shocker is: 29 million, or almost half, of the world’s richest 1% are Americans, just like you!

Then there’s some other countries, take a look…
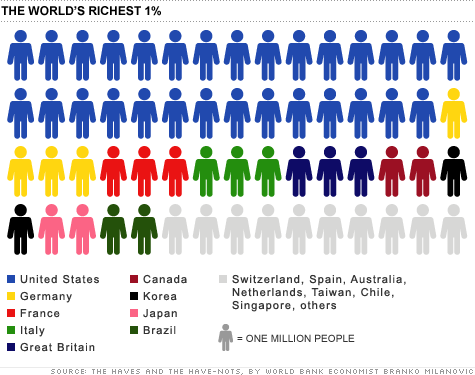
Now, this chart was part of an article on CNNMoney only a month ago, but we are told the data is from 2005.  Then you count the little chart people, find only 60, and rightly exclaim, “Hey, we hit 6 billion in 1999.”  For 2005, this chart would need four or five more people depending on which way you round it.  It might not seem like much or that long of a time, but world GDP went from $40B to $60B in the same period.  The question is, how would it change our $34,900 number?

But say you do top that number, then look around your surroundings and rightly exclaim, “Hey, I’m not rich.”  Just read the end of the article, silly.  We’re talking about the entire world here.  The world in which the global median income is $1,225/year. “In the grand scheme of things, even the poorest 5% of Americans are better off financially than two thirds of the entire world.”  …  That’s where the record skips.  If you want to hear some reactions to this conclusion, check out the 1,000+ comments that have piled up.  They range from pointing out the differences in cost of living around the world to accusing the writer of trying to take the heat off America’s 1%.

The disconnect is from measuring richness by income, as opposed to wealth.  Yes, remember wealth.  That’s what you’re missing.  Assets.  Your life should make sense again as soon as you hear that it takes $500,000 of assets to put you into the richest 1% worldwide.

How many little chart people would the U.S. get in this scenario?  37%, or 22 people.  The chart above was only off by 11%, but it completely missed the boat on Japan, which should have 16 people.  Anyway, what about the American 1%?  How much yearly income does it take to get in that club?  Well if you believe CNNMoney, they say it was $343, 927 in 2009, a measly 10 times what they were selling last month.

And before you think they might be trying to show both sides, note that this second article starts out by baiting you with the idea that it would take a million dollar income to be in the top 1%.  Surprise, you only need a third of a million!   Or, 37 times what the poorest 20% of Americans make on average, 14 times the next, 7.7 times the middle, and 4 times the fourth quintile.

As ThinkProgress would love to explain further, the American 1% owns 40% of the nation’s wealth, including 50% of all U.S. stocks, bonds and mutual funds, and takes home 24% of the nation’s income.

When it comes to world wealth, it looks a lot like yesterday’s map.
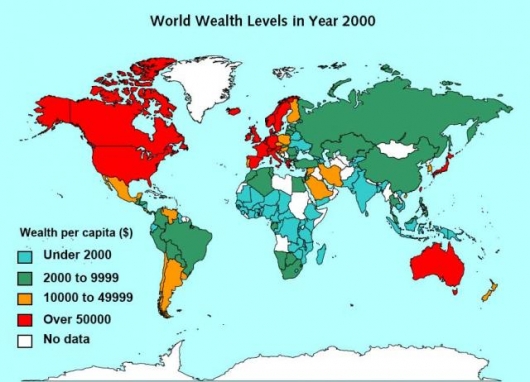
And back where we started, the crowd walks away wondering what it was all about anyhow.

[Map from World Institute for Development Economics Research via Gizmag]
1 2 3 4 5 6