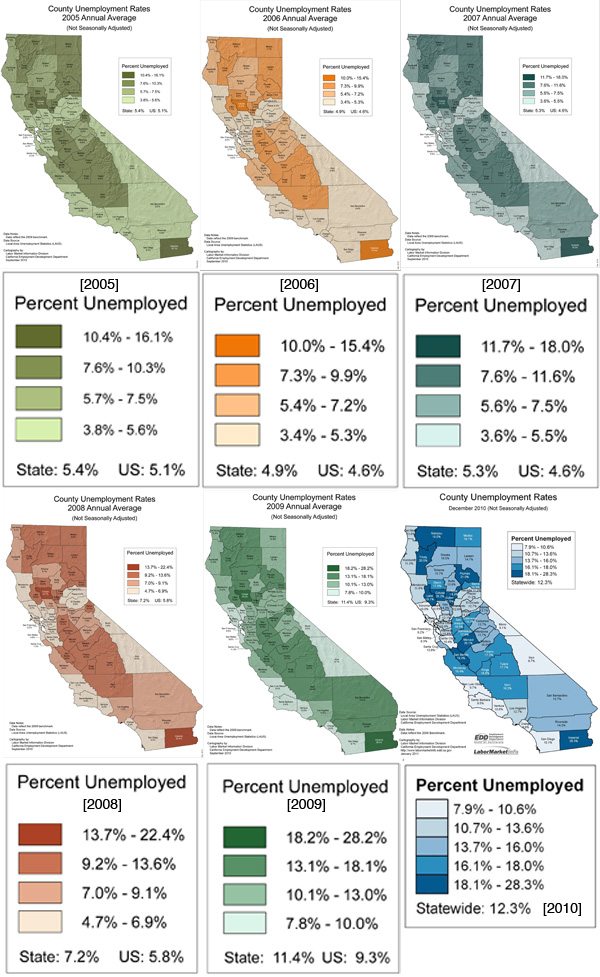
The maps tell one story. The legends tell another.

The maps tell one story. The legends tell another.

With Silicon Valley and Hollywood in the deck, you’d hope California’s GDP would be more fun. Â But then you look and the largest industry is Real Estate and Renting and Leasing, i.e. paying to occupy existing structures. Â … Â I guess we have a very loose definition of economic output.
(You can switch Label and Color to get the second graph, but it’s nice to have them both going at once.)
For a refresher on economic sectors, check out the posts from 00019 – NAICS.
In California, the real money is in the country…
[Population data via U.S. Census Bureau: State Pop, Metro Pop] [GDP data via Bureau of Economic Analysis: State GDP, Metro GDP]

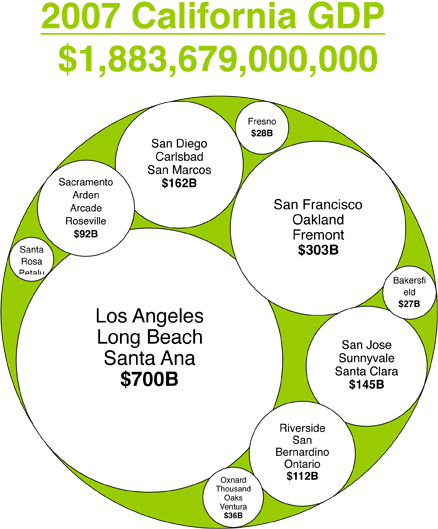
[Data via Bureau of Economic Analysis: State GDP, Metro GDP]

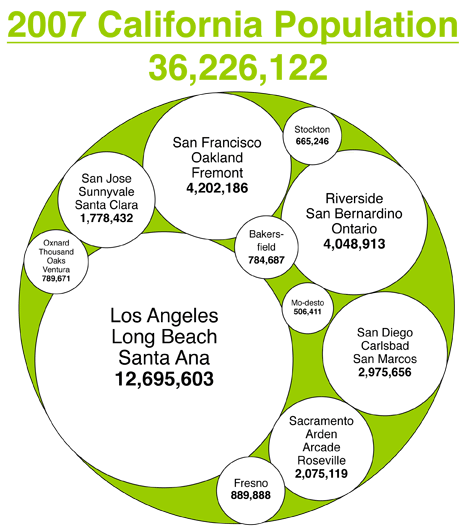
[Data via U.S. Census Bureau: State Pop, Metro Pop]
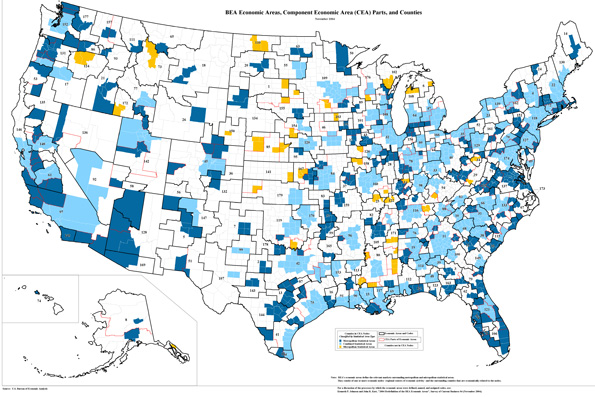
“BEA’s economic areas define the relevant regional markets surrounding metropolitan or micropolitan statistical areas. They consist of one or more economic nodes – metropolitan or micropolitan statistical areas that serve as regional centers of economic activity – and the surrounding counties that are economically related to the nodes.”
 (click for BEA’s enlarged version)
Annual income data by area for 1979-2008 can be found through the BEA’s interactive Bearfacts map.
[Map via Bureau of Economic Analysis]