Here’s Where Trusting S&P Would Really Come In Handy

In case you left the office on Friday for a weekend in the woods and are wondering why the sky is falling this fine Monday morn, Standard & Poor’s has downgraded the long-term sovereign credit rating of the United States from AAA to AA+.

(!)

What does it all mean?  How did it come to this?  As usual, the answer depends on who you ask, which might mean no one really knows, but who would be qualified to say?

The problem with taking this as seriously as one might was summed up by Ezra Klein in the Washington Post:

Standard Poor’s didn’t just miss the bubble. They helped cause it. They were paid by the banks to award their AAA-stamp of approval to all manner of financial products that were anything but riskless — which, ironically, makes them an accessory to the resulting explosion of U.S. debt. You’ve heard the old joke about chutzpah being a young man who murders his parents and then pleads for leniency because he’s an orphan? S&P has chutzpah. All the credit-rating agencies do. It’s built into their business, which requires them to assess the stability of markets they helped crash. It’s long been my position that the credit-rating agency model is broken and, at times, dangerous, and investors need to pay less attention to their pronouncements.

It makes it feel like (bad) theater, or simply a publicity stunt, but so have the actions of the U.S. government, as S&P pointed out:

The political brinksmanship of recent months highlights what we see as America’s governance and policymaking becoming less stable, less effective,  and less predictable than what we previously believed. The statutory debt ceiling and the threat of default have become political bargaining chips in the debate over fiscal policy.

Sure, it’s no longer clear who Congress is representing, but S&P shouldn’t be the source of the complaint.

As far as Ape Con Myth is concerned though, the major rating agencies showed their lack of judgment on the day they picked their names, which are all right up there with Okay Cleaners and Three Star Muffler.

Standard – 1b – sound and usable but not of top quality
Poor – 2A – less than adequate
Moody – 2 – subject to moods : temperamental
Fitch – 1 – polecat (any of several carnivorous mammals of the weasel family)

In summation:

Dear Everyone,

If you want theater, hire more playwrights.

Love,
Ape Con Myth

P.S.  Perhaps actors should completely replace politicians.  They know the rule: The show must go on!
To Work or Not To Work, That’s a Question?

How many people does it take to make the not-so-merry-go-round go round?  If you’re talking about the United States economy in 2007, which we are, then the answer is 146,047,000 people, or … wait for it … 48.4% of the population.

Did you think it would be more?  Either way, it certainly brings new meaning to the next logical question: How does the other half live?

Let’s look at some basic numbers:

As you would expect, kids and the retired account for much of this other half who magically don’t have jobs, though there are about 50 million working-age wizards out there.  It’s interesting to know whether they want a job or not, but isn’t the real question, do they need one?

Meanwhile, ‘Civilian Noninstitutionalized Population’ is one of the creepier ways of speaking about people over 15 years old who aren’t in the military, prison, a nursing home, etc.  How about Civilian Labor Force Pool or simply People Who Can Work?

While the Institute for the Study of “Making a living” will continue to explore how the noninstitutionalized do and don’t make ends meet, ACM’s take-away is that it didn’t take everyone to create the world’s largest economy in 2007.  The next question is, how many of those jobs were mission critical?

Which mission?  We will consider a few.

Top 50 Websites in the U.S.

posted in: ACM images, Input, Smog 0

That is, the top 54 websites according to Alexa on June 28th, 2011, minus technical/non-user sites at #34 and #41 and adult sites at #43 and #50.

The only surprise on this list might be Myspace’s continued presence. For a dying website, it still makes the top 50, out of, you know, over 100,000,000 active sites. But also of note is the quick and dramatic drop-off in reach, or the estimated percentage of internet users visiting a site. While Google racked up 52% and Facebook 43% reach yesterday, a great many in this grouping didn’t break 2%.


Wonder what this would look like broken out by owner…

Update: This is what it looks like.

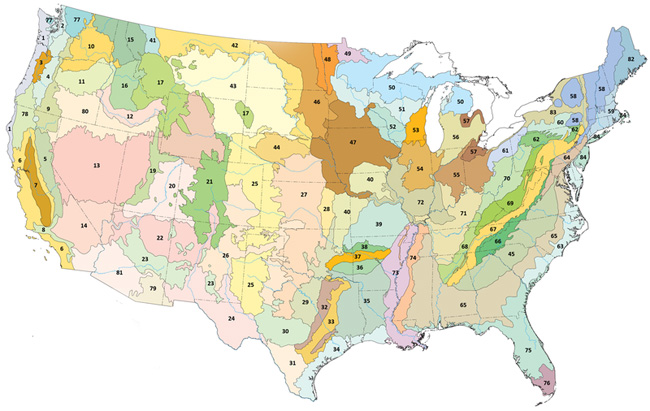
United States Ecoregions

For states that are united, there sure are a lot of ways to break them down.  Most, however, are nothing much to look at compared with how nature’s divisions sketch out…

Click on the map to find out what all those numbers mean on Wikipedia, or if you want to go straight to the source, the EPA’s Western Ecology Division has some beautiful pdfs available for download, including state-level maps.

Honorable mention goes to the World Wildlife Fund’s list of U.S. ecoregions.  Always good to have a second source.

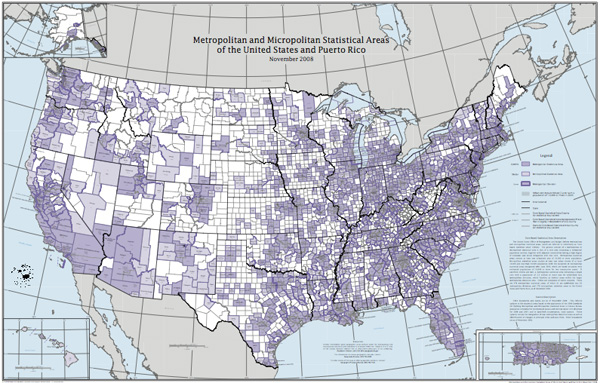
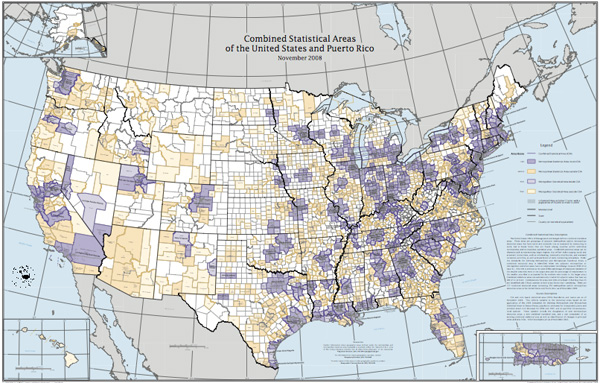
Statistical Areas of the United States

Core Based Statistical Area Description: “The United States Office of Management and Budget defines metropolitan and micropolitan statistical areas, which are referred to collectively as “core based statistical areas” (CBSAs). The general concept of a metropolitan or micropolitan statistical area is that of a core area containing a substantial population nucleus, together with adjacent communities having a high degree of economic and social integration with that core. Metropolitan statistical areas contain at least one urbanized area of 50,000 or more population. Micropolitan statistical areas contain at least one urban cluster of at least 10,000 and less than 50,000 population. CBSAs are composed of entire counties. There are 374 metropolitan statistical areas, of which 11 are subdivided into 29 metropolitan divisions, and 579 micropolitan statistical areas in the United States and Puerto Rico, as of November 2008.”

(click for enlarged Census Bureau versions)

[U.S. Office of Management and Budget home; Wall map versions available via U.S. Census Bureau; more Statistical Area info here (MSA) and here (CBSA)]

1 2