Waking Up on the Wrong Side of Your Head

posted in: Ape Con Myth, Maps 0

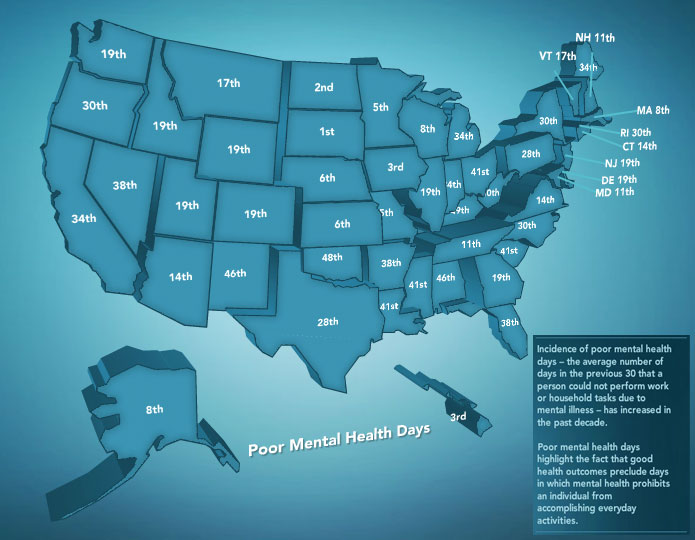
And now it’s time to play, Guess Which Way the Rankings Go!

Is 1st place South Dakota or 50th place West Virginia the state with the least or most Poor Mental Health Days?

This is just one example of the fun to be had at America’sHealthRankings.org, where you’ll find both an interactive map and timeline of state performance on a wide array of health issues along with a large resource of actions you can take to support your favorite cause.

Another game to play when confronted with a somewhat random website full of stats is, Why Does This Site Exist and Who’s Behind It?  “America’s Health Rankings” is about as generic as the name under it, United Health Foundation.  The United Health Foundation, of course, was established by the United Health Group, which you might or might not recognize as the largest single health carrier in the United States.  What’s their motivation?  Perhaps the same as yours.  They probably don’t want you to have to go to the doctor either.

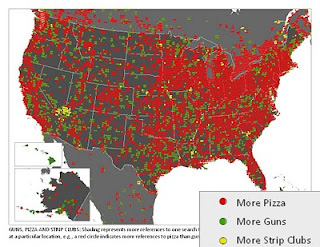
More Pizza, More Guns, More Strip Clubs

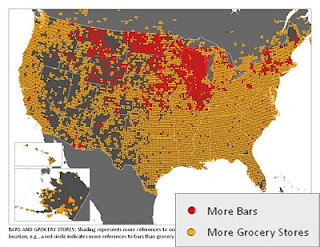
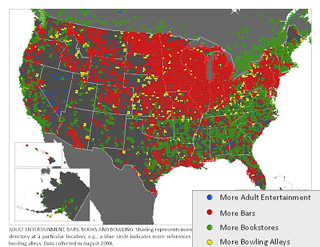
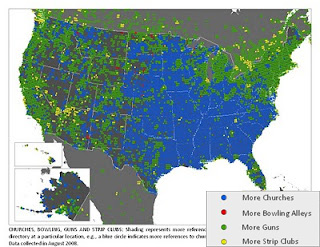
There’s probably a perfectly reasonable explanation behind every one of these data points, aside from paying customers, but until someone figures them out, enjoy generating your own theories about this collection of maps from Floating Sheep.  Each shows the prevalence of various public venues in the landscape of American culture based on results from the Google Maps directory.

Click the map for a larger version, click the match-up for the original Floating Sheep post:

[Bars vs Grocery Stores] [Adult Ent vs. Bars vs. Books vs. Bowling]
[Pizza vs. Guns vs. Strip Clubs] [Church vs. Bowling vs. Guns vs. Strip Clubs]

Find more maps and fun at Floatingsheep.org.

The State of Corruption (or The Barn Door is Open)

Will there be a point before the robots take over when we elect machines to public office?

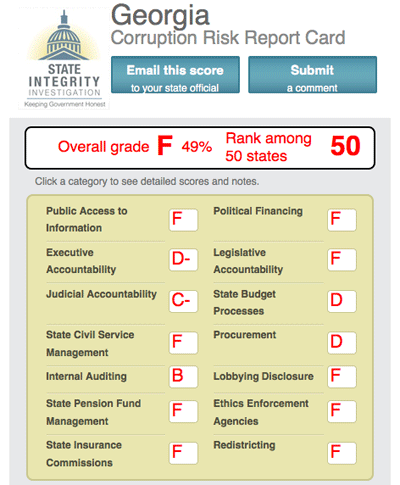
Consider the question again after looking at The Center for Public Integrity‘s Corruption Risk Report Card for state governments in the U.S….

Who would get the job with a transcript like that?  Unfortunately, those are the jobs’ ratings!  Now, fill the role with a human, factor in that power tends to corrupt and how power without status can produce worse results.  Where are our expectations now?

The Center for Public Integrity’s plan is to bring attention to the specific risks of corruption and move along the slow process of reform.  They’ve already helped accelerate efforts in five states and have set it up so you can help do the same in yours.

Check out your state’s results and click to send them on to your representatives so they know you know they know, you know?

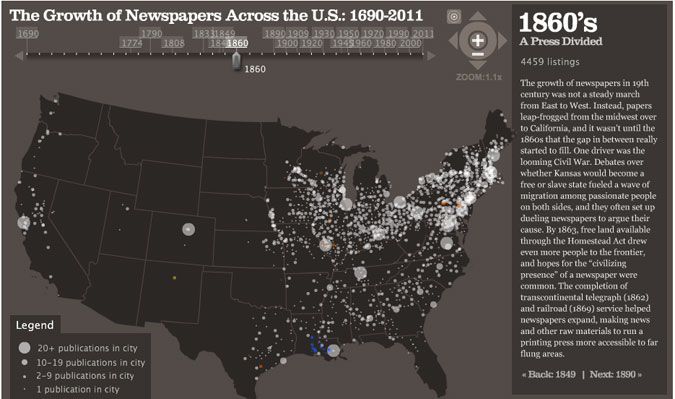
U.S. Newspapers in the Fourth Dimension

See how the light spread from sea to shining sea…

(click for interactive map)

Those spots of color are papers in different languages.  Maybe next someone will make one of these where the holdings of the media conglomerates are shaded in by owner.  MediaOwners.com would be a great place to start for such an endeavor.  (Or has it already been done?  Please comment if you know.)

Meanwhile, you can probably follow some of the dots’ comings and goings by cross-referencing this chart of historical U.S. metropolitan area population rankings.

[Map by Stanford University’s Rural West Initiative via visual.ly]

A Vote to Remember

Paying attention to politics is not a rewarding effort.  It’s one thing to hear about everything Congress passes into law and another to keep up with the all the things they are considering.  With the media and activists from both sides joining in, citizens are quickly turned into EMTs, called from one emergency to the next with constant email blasts.

Even if you hold out for the big issues, there’s plenty to keep you busy.  Last month it was the multiple copyright bills bouncing around the House and Senate that would basically give corporations the ability to censor the internet and enable a flood of lawsuits aimed at consumers.  The effort to stop SOPA and PROTECT-IP seems to be paying off, but the threat remains and action is still required.

This month, however, the stakes are even higher.  What is it this time?  Oh, just the prospect of indefinite detention of U.S. citizens on U.S. soil.  No lawyer.  No trial.  Taxpayers could go straight to military prison, no longer having “due process” in their democracy bundle package.

The bill, S. 1867: National Defense Authorization Act for Fiscal Year 2012, is part of a yearly ritual where the military is sure to eventually get their money, which is starkly evident in the different votes for the bill and for the amendment to the bill, S.Admt.1107, proposed by Sen. Udall [D-CO], which would have scrapped the whole “indefinite detention” issue.

What’s worse: Senators specifically voting to allow indefinite imprisonment of their constituents or senators who voted to remove those provisions and, upon failing, voted for the bill containing said provisions?  Does something this big really have to come down to a veto?

It’s no wonder Congress’ disapproval rating is stuck in the 80% range.  We’ve got a little under a year before we get a chance to restock the ranks of Congress and this is a vote to remember then.

For more color on the situation, take your pick: Gawker breaks it down piece-by-piece, The Daily Show makes it sad but funny, plus articles from Forbes, Christian Science Monitor, Rolling Stone and the ACLU.

[Maps from GovTrack]
Say Hello to Your PostNatural World

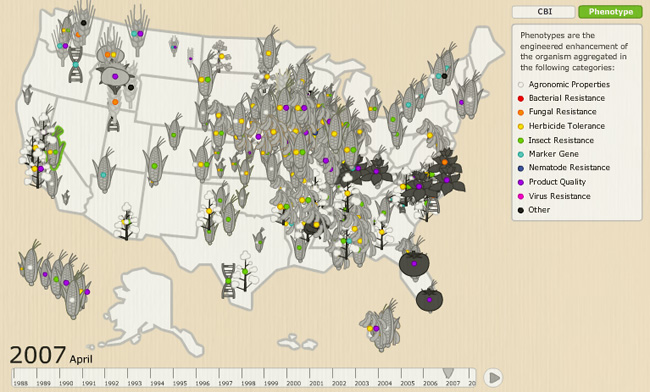
Don’t let the continued debate over genetically modified foods fool you.  Field tests of GMO’s have been going full steam ahead.  Below you can see what was tried out in April 2007 alone.

If you missed yesterday’s Millions Against Monsanto in honor of World Food Day, there’s still two weeks left in October, which just happens to be Non-GMO Month.  Remember, knowing is half the battle, even with genetically modified foods, and that’s the half we’re still working on.  Tell the FDA that the least they can do is label it.

[Map from Center for PostNatural History (Thanks, Mason!)]

Plan for the Temporary Relocation of All U.S. Residents

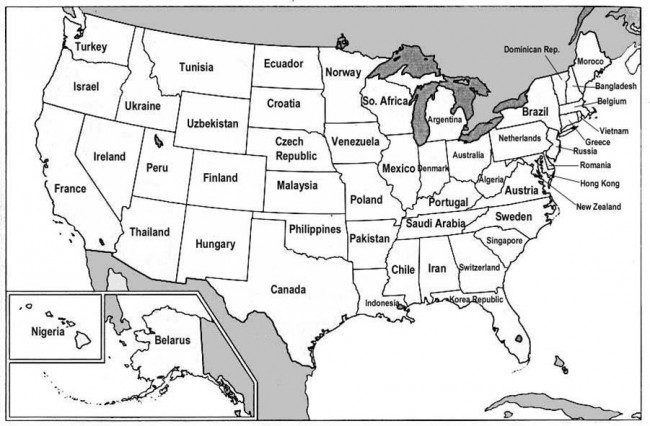
In response to continued economic hardship, Ape Con Myth recommends that the entire population of the United States take a vacation as soon as possible. Please refer to the map below to find your destination.  Each state has been assigned a foreign country with a comparable GDP.

USstatesCountryGDP

To complete the exercise, write a short essay on what your home state could learn from its economic counterpart, and vice versa.  Airlines are asked to provide pen and paper to all returning travelers for this purpose and to forward the collected works to Ape Con Myth for processing.  Wikipedia is an acceptable substitute for those who can’t afford the trip.  Your essays are welcome in the comments.

[Map via Big Think‘s Strange Maps; Thanks to scribblesabit]

Dear Humans, I Don’t Need Most Of You To Be That Smart. Sincerely, The Economy

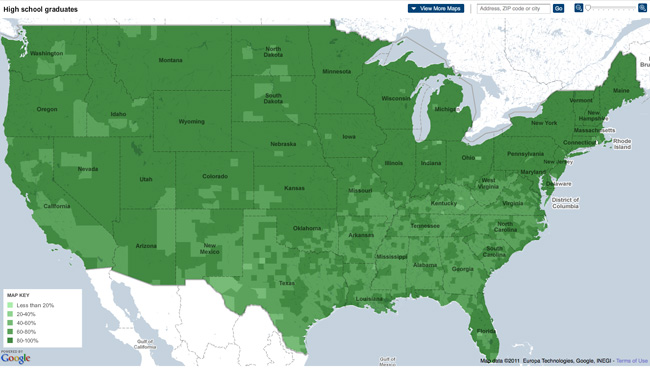
Here’s some lush U.S. high school graduation rate census data for you.  The lighter the green, the lighter the course load…

HighSchoolGrads-NYT

(click for live map where you can drill down into the gory details)

That is a lot of people not doing their homework.

On the other hand, if there are more college and PhD graduates than the economy can handle, then the same likely applies to high school grads, though who would want to admit that?

It’s not the economy, stupid.  It’s a stupid economy.

[Map from NYTimes]

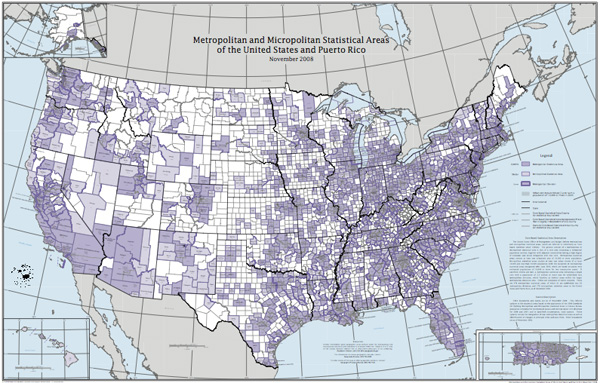
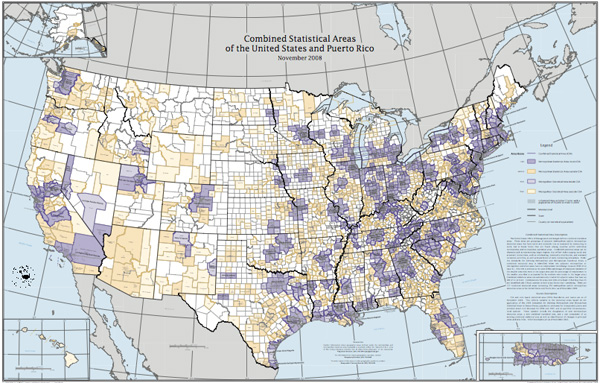
Statistical Areas of the United States

Core Based Statistical Area Description: “The United States Office of Management and Budget defines metropolitan and micropolitan statistical areas, which are referred to collectively as “core based statistical areas” (CBSAs). The general concept of a metropolitan or micropolitan statistical area is that of a core area containing a substantial population nucleus, together with adjacent communities having a high degree of economic and social integration with that core. Metropolitan statistical areas contain at least one urbanized area of 50,000 or more population. Micropolitan statistical areas contain at least one urban cluster of at least 10,000 and less than 50,000 population. CBSAs are composed of entire counties. There are 374 metropolitan statistical areas, of which 11 are subdivided into 29 metropolitan divisions, and 579 micropolitan statistical areas in the United States and Puerto Rico, as of November 2008.”

(click for enlarged Census Bureau versions)

[U.S. Office of Management and Budget home; Wall map versions available via U.S. Census Bureau; more Statistical Area info here (MSA) and here (CBSA)]

1 2