The Global Innovation Olympics

As a counterpoint to Olympic medal counts, see how the nations of the world stack up in terms of innovation and, crowd-favorite, GDP per capita:

From the GII release:

For the second year running, Switzerland, Sweden, and Singapore lead in overall innovation performance according to the Global Innovation Index 2012 (GII): Stronger Innovation Linkages for Global Growth, published by INSEAD, the leading international business school, and the World Intellectual Property Organization (WIPO), a specialized agency of the United Nations.
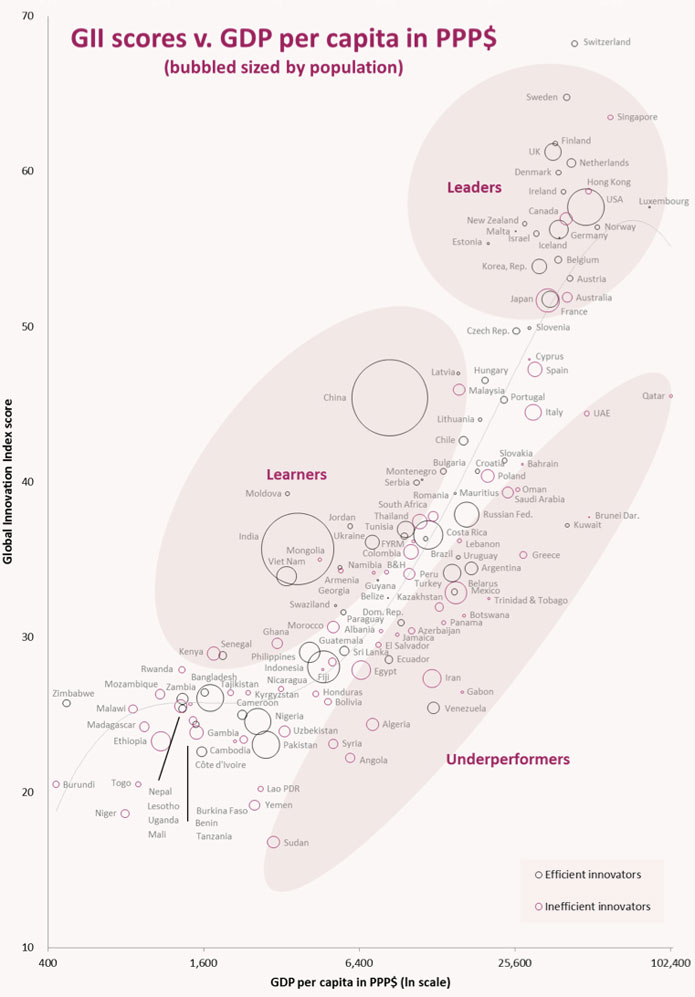
You can see why they put the one on tv and not the other.

Go team.

[Chart from The Global Innovation Index via The Economist]

The Best Laid Projections of Mice and GDP

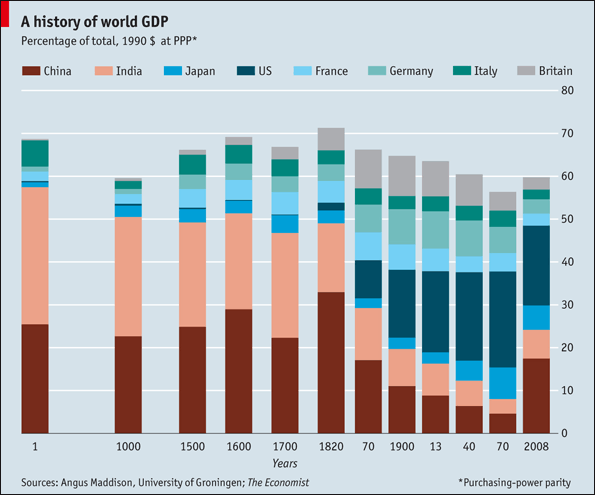
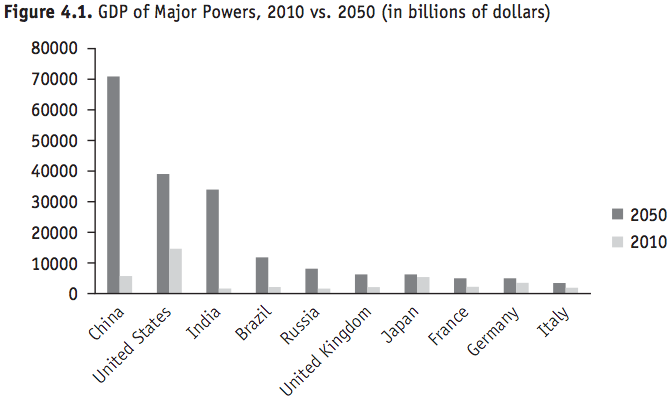
What did we know about 2010 in 1970?  What do we know about 2050 GDP in 2010?

This is what Goldman Sachs thinks…

We know/assume/hope the future will be MORE.  But how much more and what does it mean?  Numbers go up, but how real is the growth?  In the end, they are just numbers and there’s always the chance they will add up to LESS.  The wheel of fortune spins after all.

Here’s a little background on these players historically…

Imagine what this chart will look like in 4016, when we will be firmly lumped with the rest of ancient history.

[Charts via The Atlantic and The Big Picture, respectively]

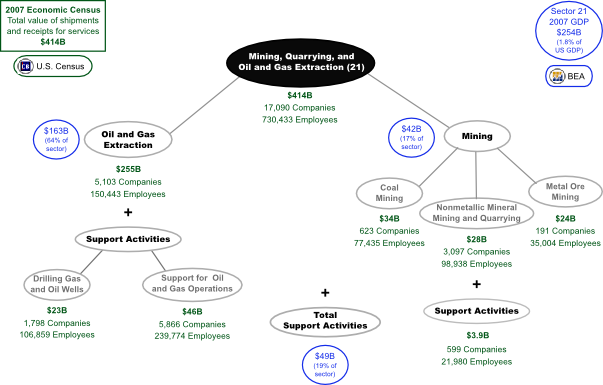
GDP by NAICS (or, Here Come the Numbers)

Here we go again, but this time all 20 economic sectors link to a first round mapping. Also, U.S. GDP figures have been added to the top level and will be trickling down over the next few weeks…

The chart below is live, or you can go to the full page version.


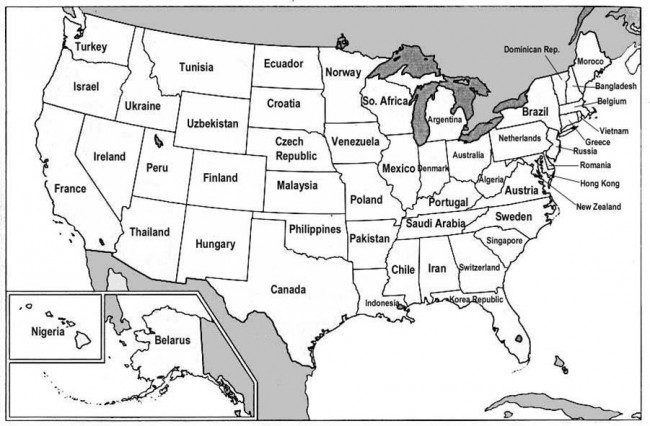
Plan for the Temporary Relocation of All U.S. Residents

In response to continued economic hardship, Ape Con Myth recommends that the entire population of the United States take a vacation as soon as possible. Please refer to the map below to find your destination.  Each state has been assigned a foreign country with a comparable GDP.

USstatesCountryGDP

To complete the exercise, write a short essay on what your home state could learn from its economic counterpart, and vice versa.  Airlines are asked to provide pen and paper to all returning travelers for this purpose and to forward the collected works to Ape Con Myth for processing.  Wikipedia is an acceptable substitute for those who can’t afford the trip.  Your essays are welcome in the comments.

[Map via Big Think‘s Strange Maps; Thanks to scribblesabit]

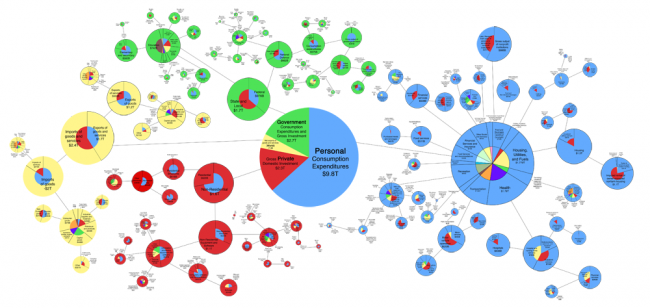
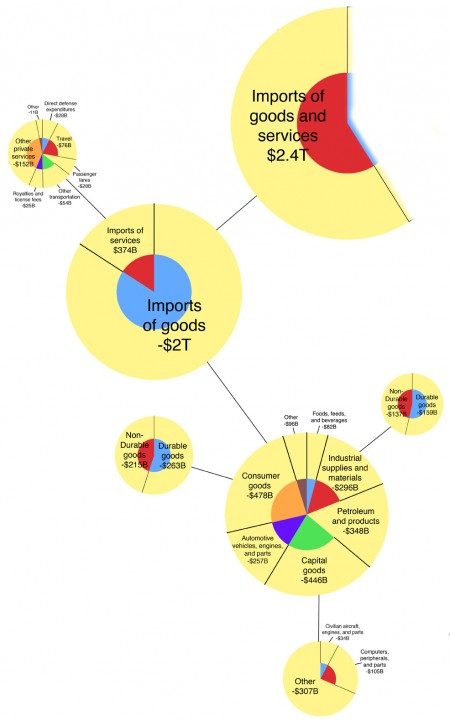
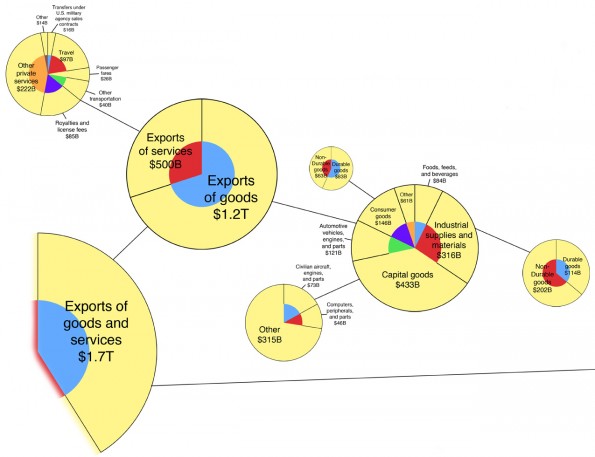
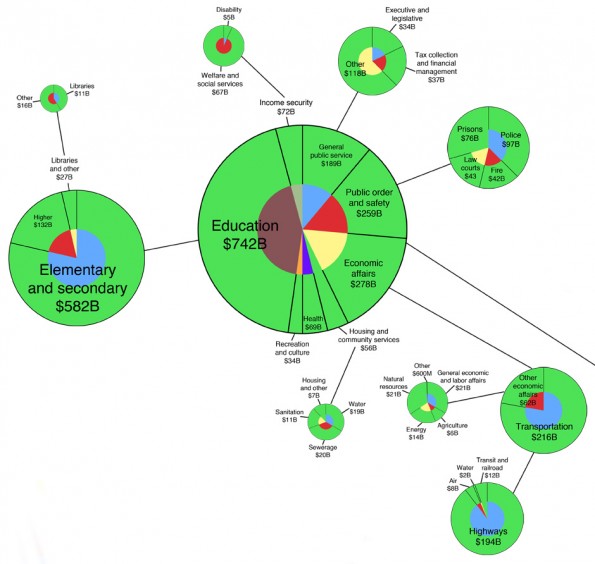
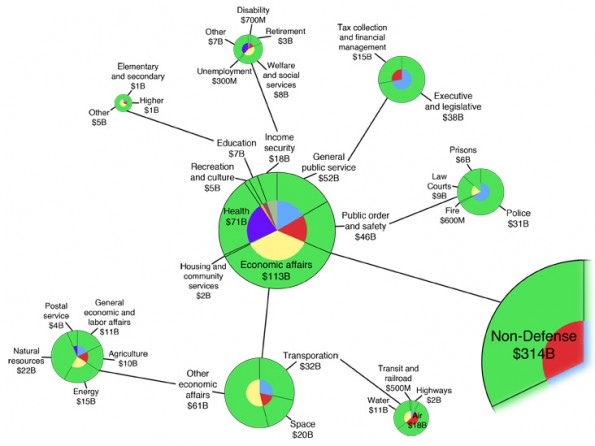
2007 U.S. GDP in Pie-Vision!

Five days a week (or more), millions of Americans leave their homes to go to “work”.  What does it all add up to?  Gross Domestic Product, the sum of all final goods and services.

Below, we have the United States’ $14.1 trillion GDP from 2007, which means you are also looking at the output from the largest economy on Earth that year.

(click image to explore – (it’s a large file, so give it a second))

What do you see?  For those game to squeeze their mind grapes, please put any thoughts or questions in the comments to guide future research.  This is only the beginning of digging into GDP…

1 2 3